<?xml version="1.0" encoding="utf-8"?><feed xmlns="http://www.w3.org/2005/Atom" ><generator uri="https://jekyllrb.com/" version="4.4.1">Jekyll</generator><link href="https://brendonmatheson.com/feed.xml" rel="self" type="application/atom+xml" /><link href="https://brendonmatheson.com/" rel="alternate" type="text/html" /><updated>2026-09-08T15:44:00+00:00</updated><id>https://brendonmatheson.com/feed.xml</id><title type="html">Brendon Matheson</title><subtitle>The personal blog of Brendon Matheson, since 2001.</subtitle><entry xml:lang="[[English]]"><title type="html">On Vendor Lockin</title><link href="https://brendonmatheson.com/2026/09/07/on-vendor-lockin.html" rel="alternate" type="text/html" title="On Vendor Lockin" /><published>2026-09-07T00:00:00+00:00</published><updated>2026-09-07T00:00:00+00:00</updated><id>https://brendonmatheson.com/2026/09/07/on-vendor-lockin</id><content type="html" xml:base="https://brendonmatheson.com/2026/09/07/on-vendor-lockin.html"><![CDATA[<p>A customer conversation that comes up from time to time for us Cloud Architects is the one about vendor lockin.</p>
<p>Its obviously wise to be wary of lockin - but it is also possible to take an overly simplistic view on avoiding vendor lockin and this can actually cost more in the long-run.</p>

<p>I’m currently a consultant for a cloud provider (AWS), but in the past I’ve been on the other side of the table - having to make technical and vendor choices where <em>I’ve</em> been the one worried about lockin.  As a result I’ve ended up with a certain perspective and mindset that has served me well when it comes to managing potential lockin.</p>

<p>I’d like to share that with you.</p>

<p><strong>tl;dr:</strong> To make better choices, ask your teams to add two things to their pro’s and con’s analyses:</p>

<ul>
  <li>
    <p>Likelihood (high / medium / low) of needing to switch in the future and why this might happen</p>
  </li>
  <li>
    <p>How we would switch if we had to and an estimate of the cost to do so.</p>
  </li>
</ul>

<h2 id="can-we-just-avoid-vendors">Can We Just Avoid Vendors?</h2>

<p>I have worked with customers who wanted to avoid potential lockin to AWS and so chose open-source or open-core solutions instead.</p>

<p>For example a customer I worked with here in South-East Asia was uncomfortable with the potential of being locked into the AWS cloud-native CI/CD tools and so instead selected self-managed on-cloud GitLab for version control and self-managed on-prem Jenkins for CI/CD orchestration.  Now GitLab and Jenkins are both excellent tools but are we free from vendor lockin now?  Well GitHub is a for-profit company who offer an open-core version of their product (but you’ll probably want to sub to GitLab enterprise) and Jenkins is an open-source project - both are vendors.  Are we more or less locked into those vendors than we would have been with AWS if we’d used CodeCommit and CodePipeline?  The truth is - we don’t know yet.</p>

<p>But what if we REALLY wanted to avoid vendors - we could build our own VCS and CI tools!  But what would we build them with?  Java vended by Oracle?  Rust vended by the Rust Foundation?  And what would we run these tools on?  A Linux distribution we compiled ourselves from source?  But where would we get those sources from - the Linux Foundation and the GNU project!   And how would we compile them?  Using gcc also from the GNU project!</p>

<p>Unless you literally want to build EVERYTHING yourself right down to the silicon (which you’ll be mining yourself), you cannot and should not even try to AVOID vendors.  Instead you should select the RIGHT vendors and products.  But the question remains: how do we select vendors that won’t lock us in?</p>

<h2 id="what-even-is-vendor-lockin-even">What Even is Vendor Lockin Even?</h2>

<p>What do we actually mean by vendor lockin?  To be locked in means we’re stuck with a choice we made previously even when we’d really rather move to a different option now.  How might we end up in this situation?</p>

<p>One way is if we sign up to a long-term or exclusive contract with a vendor.  In the cloud world this is increasingly rare - for example AWS operates primarily on utility pricing where you pay only for what you consume.  You can opt-in to longer term commitments with reserved instances or savings plans but even here you have flexibility to change your choices within those commitments.   True contractual lockin is relatively rare today except from unscrupulous vendors.</p>

<p>Lockin could also happen if we have very specific functional needs that can only be serviced by one vendor.  Normally this will be resolved over time as new vendors come in to compete with that incumbent and give us more choices and drive down the prices.  Unless we want to <em>become</em> that new vendor all we can do is wait for the free market to take it’s majestic Adam Smithian course and supply us with new options.</p>

<blockquote>
  <p>To manage vendor lockin we need to focus on managing potential future switching costs.</p>
</blockquote>

<p>The third and by far most common cause of lockin is where the cost to switch technologies is prohibitive either in terms of raw labour cost to execute the change, or where the effort to make the change represents an opportunity cost compared to some other improvement we could be making. To manage vendor lockin we need to focus on managing <strong>potential future switching costs</strong>.</p>

<p>Fortunately in addition to being the main cause of vendor lockin, switching costs are also the cause we can do the most to manage and avoid.  But more on that in a moment.</p>

<h2 id="types-of-lockin">Types of Lockin</h2>

<p>Now that we recognize that vendor lockin is mostly just poorly managed future switching costs - can switching costs lead to other types of lockin aside from vendor lockin?  Indeed they can - here are a couple of examples:</p>

<ul>
  <li>
    <p><strong>Skilset lockin</strong> - I had a situation in a previous role where some rather stubborn developers insisted on building a critical component in Golang while the rest of our engineering org were .NET developers.  This created a switching cost problem for us which we were forced to incur when those developers left the organization (now with Golang in their CV’s) and we were forced to rewrite that service in C# for maintainability.</p>
  </li>
  <li>
    <p><strong>Standards lockin</strong> - when you bind your software to a standard or protocol you may be creating a future switching cost problem depending on how you architect your solution.  For example if your application today exposes REST API’s but later you want to support GraphQL - how locked into REST are you?  It depends on how you have layered the software behind that REST API.</p>
  </li>
</ul>

<p>We could go on, but hopefully the point has been made that it is not only vendor lockin but lockin in general is mostly the result of poorly managed future switching costs.</p>

<h2 id="managing-switching-costs">Managing Switching Costs</h2>

<p>Most customers (and cloud consultants) will assess a choice based on a pro’s and con’s comparative analysis of the available options.  Such an analysis normally pays attention to the functional capabilites of the options, the cost, compatability with existing team skillset, and fit with the technology estate of the organization.</p>

<p>To make a pragmatic assessment of lockin risk we need to add two more things to that comparative analysis:</p>

<ul>
  <li>
    <p>Likelihood (high / medium / low) of needing to switch in the future and <em>why</em> this might happen</p>
  </li>
  <li>
    <p>How we would switch if we had to and an estimate of the cost to do so.</p>
  </li>
</ul>

<p>Now - we are able to compare options based on their future switching costs and the likelihood that we will need to incur those costs.  This gives us a way to now objectively assess the “lockin” propensity for the options we have on the table.</p>

<p>Even more importantly - we are also now able to make an informed trade off of future <em>potential</em> switching vs <em>immediate</em> benefits.  Sometimes it’s better to choose an option with potential future switching costs if it enables us to get a strategic advantage over our competitors today.</p>

<h2 id="example-1---cloud-native-vs-self-managed-cicd">Example 1 - Cloud-Native vs Self-Managed CI/CD</h2>

<p>TODO</p>

<h2 id="example-2---todo">Example 2 - TODO</h2>

<p>TODO</p>]]></content><author><name></name></author><category term="jekyll_post" /><summary type="html"><![CDATA[A customer conversation that comes up from time to time for us Cloud Architects is the one about vendor lockin.]]></summary></entry><entry xml:lang="[[English]]"><title type="html">Fridge Bottle Rack</title><link href="https://brendonmatheson.com/2022/06/17/fridge-bottle-rack.html" rel="alternate" type="text/html" title="Fridge Bottle Rack" /><published>2022-06-17T21:41:00+00:00</published><updated>2022-06-17T21:41:00+00:00</updated><id>https://brendonmatheson.com/2022/06/17/fridge-bottle-rack</id><content type="html" xml:base="https://brendonmatheson.com/2022/06/17/fridge-bottle-rack.html"><![CDATA[<p>Earlier this year I solved the problem of untidy drinking water bottles in my refridgerator - here’s how</p>

<center>
<iframe width="560" height="315" src="https://www.youtube.com/embed/Cr42MsEULzg" title="YouTube video player" frameborder="0" allow="accelerometer; autoplay; clipboard-write; encrypted-media; gyroscope; picture-in-picture" allowfullscreen=""></iframe>
</center>
<!-- excerpt end -->]]></content><author><name></name></author><category term="3dprinting" /><category term="jekyll_post" /><summary type="html"><![CDATA[Earlier this year I solved the problem of untidy drinking water bottles in my refridgerator - here’s how]]></summary></entry><entry><title type="html">Updated Grafana Dashboard for pfSense Network Activity</title><link href="https://brendonmatheson.com/2022/06/11/updated-grafana-dashboard-pfsense-network-activity.html" rel="alternate" type="text/html" title="Updated Grafana Dashboard for pfSense Network Activity" /><published>2022-06-11T18:52:00+00:00</published><updated>2022-06-11T18:52:00+00:00</updated><id>https://brendonmatheson.com/2022/06/11/updated-grafana-dashboard-pfsense-network-activity</id><content type="html" xml:base="https://brendonmatheson.com/2022/06/11/updated-grafana-dashboard-pfsense-network-activity.html"><![CDATA[<p>During the week an engineer from France reached out to me via LinkedIn asking if I could share the Grafana dashboard for pfSense that I screenshotted in my post on <a href="/2021/02/07/step-by-step-guide-to-connecting-prometheus-to-pfsense-via-snmp.html">connecting Prometheus to pfSense via SNMP</a>.  As it happens I’ve just been making updates to that dashboard so it’s a good time to share the code and explain how to adapt it.</p>

<p>You can get the Grafana dashboard code for this dashboard from here: <a href="/content/2022/2022-06-11-updated-grafana-dashboard-pfsense-network-activity/dashboard.json">dashboard.json</a></p>

<p>The details of the dashboard are very specific to my environment in terms of network interfaces and hosts so it’s not a drop-in solution, but with an understanding of how it works it’s trivial to customize it to your needs.</p>

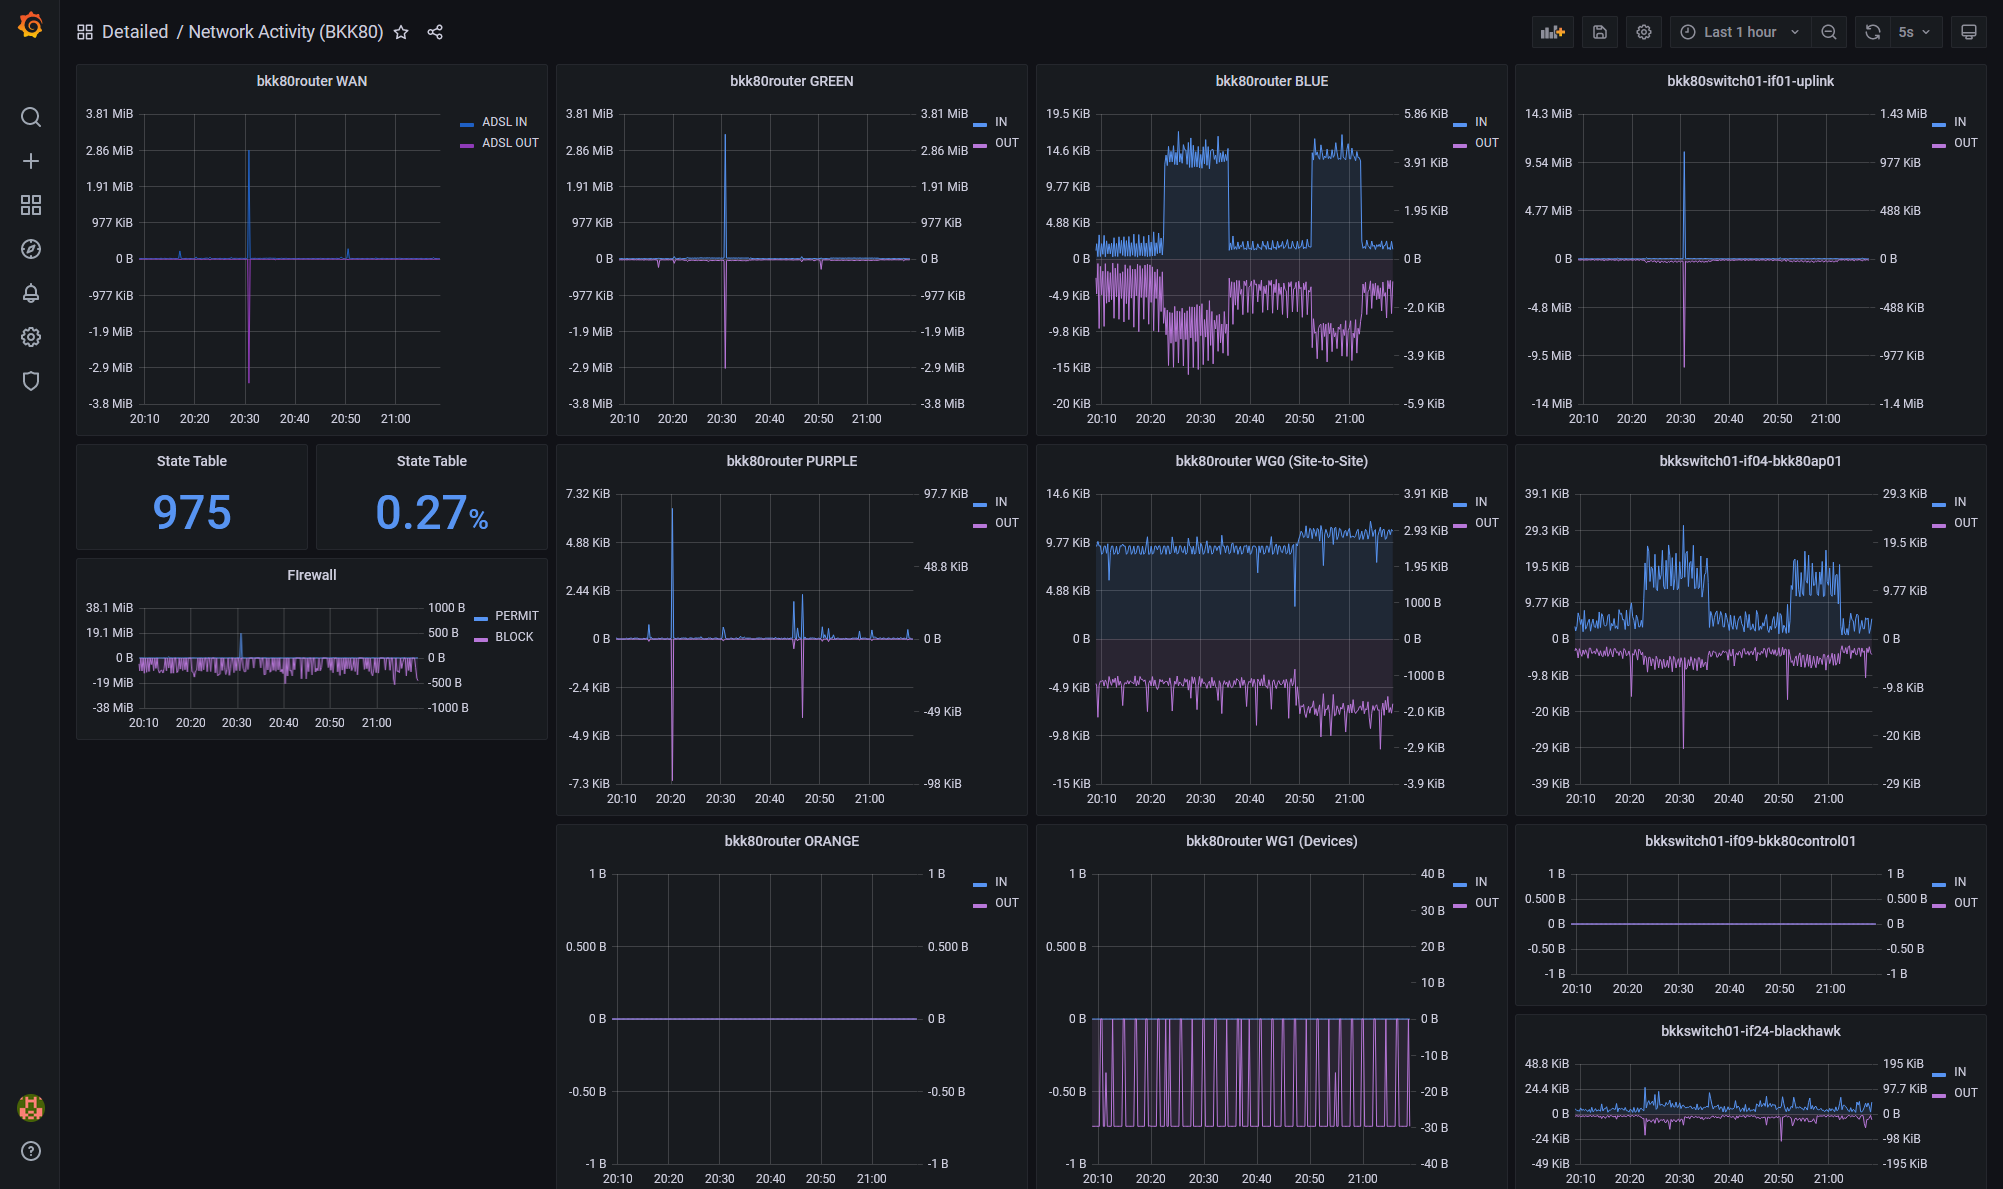
<p>To recap - this dashboard shows network statistics pulled from my <a href="https://www.pfsense.org/">pfSense</a> router by Prometheus via SNMP.  Actually it also shows stats from key interfaces on my <a href="https://store.ui.com/products/usw-24-poe">UniFi 24-port managed switch</a> similarly obtained via SNMP.</p>

<p><img src="/content/2022/2022-06-11-updated-grafana-dashboard-pfsense-network-activity/dashboard.png" alt="" class="img-fluid" /></p>

<p>There’s a bit going on here but there’s only three distinct types of content:</p>

<ul>
  <li>Network traffic - showing the traffic in and out from an interface - this accounts for most of the panels</li>
  <li>pfSense State Table - the number of tracked states and the percentage of state table memory used</li>
  <li>Firewall Actions - showing the number of bytes passed or blocked across all interfaces</li>
</ul>

<p>Let’s look at each in turn and how to customize the dashboard:</p>

<h2 id="network-traffic">Network Traffic</h2>

<p>In my dashboard there are several network traffic panels, which are all the same but just for different interfaces:</p>

<ul>
  <li>bkk80router WAN</li>
  <li>bkk80router GREEN</li>
  <li>bkk80router PURPLE</li>
  <li>etc</li>
</ul>

<p>As a side-note - many many years ago my first homelab firewall was based on Smoothwall where interfaces are usually described as GREEN, RED, etc.  I still use that terminology out of habit although I’m considering changing it to improve the readability of my firewall rules. GREEN is LAN, PURPLE is trusted WiFi, BLUE is IoT WiFi,etc.</p>

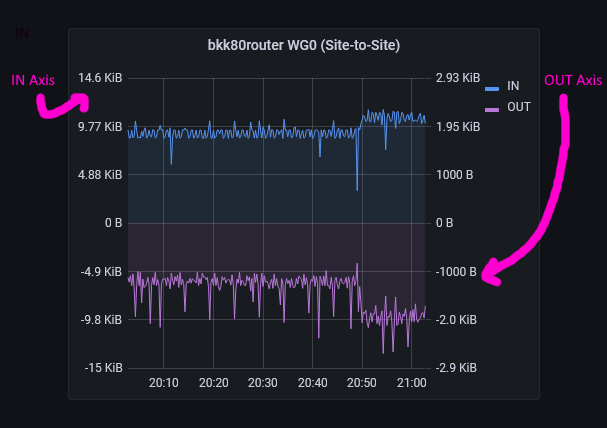
<p>Each network panel shows octets (8-bit bytes) in and out with in colored blue and out colored purple and both plotted from a common zero axis but with independent vertical scales - this is so that when there’s a lot of traffic in one direction, you can still see the peaks on the other.  It does mean you need to pay attention to the Y-axis scales which may not be to everyone’s liking but it’s how I want to see the data:</p>

<p><img src="/content/2022/2022-06-11-updated-grafana-dashboard-pfsense-network-activity/network_activity.png" alt="" class="img-fluid" /></p>

<p>If you want both directions to use the same scale you can move the OUT metric to the left axis.</p>

<p>Note that I’m still using the now-legacy <a href="https://grafana.com/docs/grafana/next/visualizations/graph-panel/">Graph</a> visualization and not the newer <a href="https://grafana.com/docs/grafana/next/visualizations/time-series/">Time Series</a> visualization because although Time Series supports dual (actually multiple) axes, I haven’t been able to get get it to center zero yet but I will be updating my dashboard once I figure that out.</p>

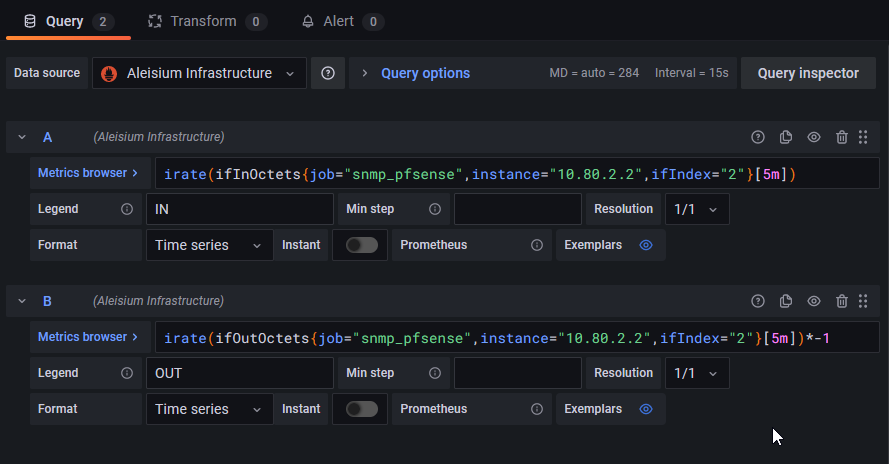
<p>Each network panel has two queries, one for IN and one for OUT like this:</p>

<p><img src="/content/2022/2022-06-11-updated-grafana-dashboard-pfsense-network-activity/network_activity_queries.png" alt="" class="img-fluid" /></p>

<p>These queries are very similar:</p>

<div class="language-plaintext highlighter-rouge"><div class="highlight"><pre class="highlight"><code># IN
irate(ifInOctets{job="snmp_pfsense",instance="10.80.2.2",ifIndex="2"}[5m])

# OUT
irate(ifOutOctets{job="snmp_pfsense",instance="10.80.2.2",ifIndex="2"}[5m])*-1
</code></pre></div></div>

<p>For IN we’re doing an irate() of ifInOctets and for OUT of ifOutOctets.  We filter on the job and instance labels to get to the right device (in my case either my pfSense box or my UniFi switch) and then ifIndex (interface index) for the specific interface we want to monitor.</p>

<p>Note I am using <a href="https://prometheus.io/docs/prometheus/latest/querying/functions/#irate">irate()</a> not <a href="https://prometheus.io/docs/prometheus/latest/querying/functions/#rate">rate()</a>.  irate() works off the last 2 metrics regardless of window size and rate() works off the entire window.  If you prefer you could do a rate() of a small window - say 30s - e.g.:</p>

<div class="language-plaintext highlighter-rouge"><div class="highlight"><pre class="highlight"><code># IN
rate(ifInOctets{job="snmp_pfsense",instance="10.80.2.2",ifIndex="2"}[30s])
</code></pre></div></div>

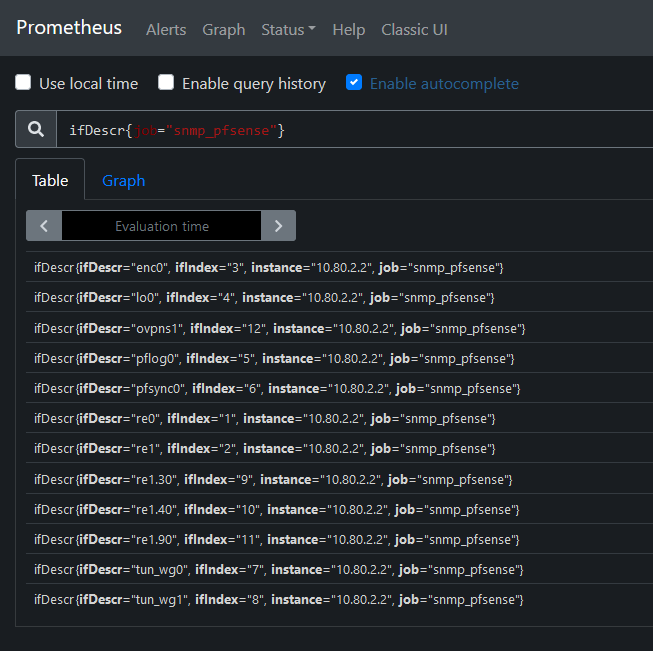
<p>The question is how do we know what to use for ifIndex?  You can find out the index of each interface by querying for <code class="language-plaintext highlighter-rouge">ifDescr</code> in your Prometheus console:</p>

<p><img src="/content/2022/2022-06-11-updated-grafana-dashboard-pfsense-network-activity/prometheus_ifdescr.png" alt="" class="img-fluid" /></p>

<p>Here we can see that, for example:</p>

<ul>
  <li>re0 - my WAN interface is index 1</li>
  <li>re1 - my LAN interface (aka GREEN) is index 2</li>
  <li>re1.90 - VLAN tag 90 on my LAN interface which is my IoT WiFi network is index 11</li>
  <li>tun_wg0 - my WireGuard site-to-site VPN is index 7</li>
  <li>etc</li>
</ul>

<p>Now that you know the index, it’s easy to adapt the queries above to show the data for the interface you’re interested in.</p>

<h2 id="pfsense-state-table">pfSense State Table</h2>

<p>In the early days of my adoption of pfSense I had a performance issue that seemed to be correlated to a state table with more than 2% utilization - for that reason I wanted to have this in my dashboard.</p>

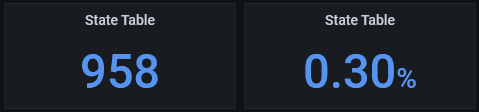
<p>I have two stat panels - one showing the number of states and the other showing the utilization of the state table:</p>

<p><img src="/content/2022/2022-06-11-updated-grafana-dashboard-pfsense-network-activity/state_table.png" alt="" class="img-fluid" /></p>

<p>The count of states is obtained from one of the pfSense-specific SNMP metrics:</p>

<div class="language-plaintext highlighter-rouge"><div class="highlight"><pre class="highlight"><code>pfStateTableCount{job="snmp_pfsense",instance="10.80.2.2"}
</code></pre></div></div>

<p>While the utilization is the percentage of the total size:</p>

<div class="language-plaintext highlighter-rouge"><div class="highlight"><pre class="highlight"><code>pfStateTableCount{job="snmp_pfsense",instance="10.80.2.2"}/360000
</code></pre></div></div>

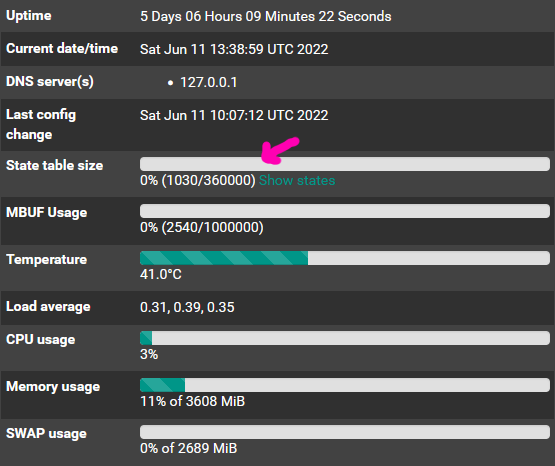
<p>360000 is hardcoded as it’s not available from a SNMP metric.  I got this number from the pfSense console:</p>

<p><img src="/content/2022/2022-06-11-updated-grafana-dashboard-pfsense-network-activity/state_table_size.png" alt="" class="img-fluid" /></p>

<p>This does vary based on RAM so check your state table size and update as appropriate.</p>

<h2 id="firewall-actions">Firewall Actions</h2>

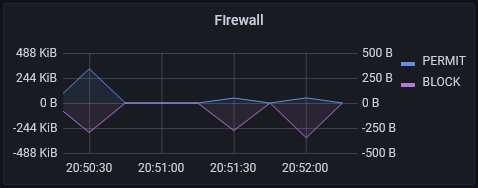
<p>Firewall actions are shown on a two axis graph similar to the network activity graphs, with PASS traffic in blue and BLOCK traffic in purple.</p>

<p><img src="/content/2022/2022-06-11-updated-grafana-dashboard-pfsense-network-activity/firewall_activity.png" alt="" class="img-fluid" /></p>

<p>The queries are:</p>

<div class="language-plaintext highlighter-rouge"><div class="highlight"><pre class="highlight"><code># PASS
sum(irate(pfInterfacesIf4BytesInPass[5m]))

# BLOCK
sum(irate(pfInterfacesIf4BytesInBlock[5m]))*-1
</code></pre></div></div>

<h2 id="conclusion">Conclusion</h2>

<p>This network dashboard gives me a high-level idea of what traffic volume looks like on my home network.  If I see something interesting in this high-level view and want to know the details then the next step would be to take a look at the pfSense state table to see recently passed traffic, or run a packet capture in pfSense or remotely with Wireshark over SSH into the router.</p>

<p>Let me know if this helps you or if you notice bugs or have ideas to improve it.  In the future I may do another update as I continue to enhance it for my needs.</p>]]></content><author><name></name></author><category term="infrastructure" /><category term="observability" /><summary type="html"><![CDATA[During the week an engineer from France reached out to me via LinkedIn asking if I could share the Grafana dashboard for pfSense that I screenshotted in my post on connecting Prometheus to pfSense via SNMP. As it happens I’ve just been making updates to that dashboard so it’s a good time to share the code and explain how to adapt it.]]></summary></entry><entry xml:lang="[[English]]"><title type="html">Google Pixel 3A XL Phone Stand</title><link href="https://brendonmatheson.com/2022/01/16/google-pixel-3axl-stand.html" rel="alternate" type="text/html" title="Google Pixel 3A XL Phone Stand" /><published>2022-01-16T17:07:00+00:00</published><updated>2022-01-16T17:07:00+00:00</updated><id>https://brendonmatheson.com/2022/01/16/google-pixel-3axl-stand</id><content type="html" xml:base="https://brendonmatheson.com/2022/01/16/google-pixel-3axl-stand.html"><![CDATA[<p>I’ve been playing with alternative phone platforms on and off for a few months now and I’m pretty much ready to make my <a href="https://www.gsmarena.com/google_pixel_3a_xl-9690.php">Google Pixel 3A XL</a> running <a href="https://grapheneos.org/">GrapheneOS</a> my daily driver, so I need a couple of stands for it - one for my bedside and one for my desk.</p>

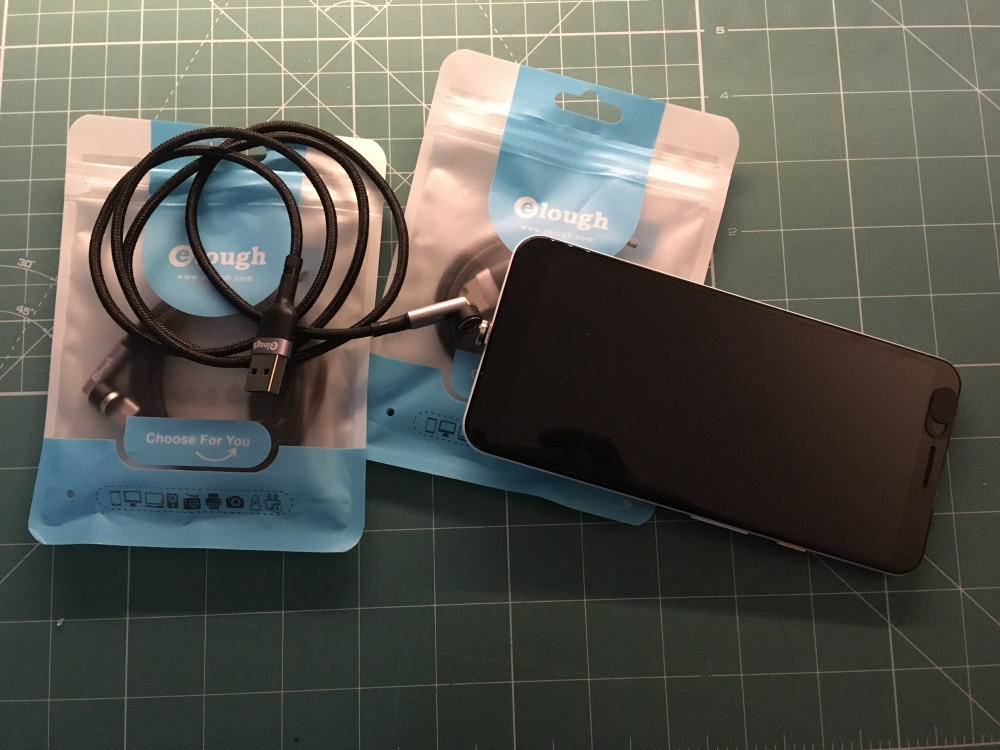
<p>I decided to design my stands around a mag-safe-style USB cable, and ended up grabbing three of these “elough”-brand cables:</p>

<p><img src="/content/2022/2022-01-16-google-pixel-3axl-stand/IMG_1940.JPG" alt="" class="img-fluid" /></p>

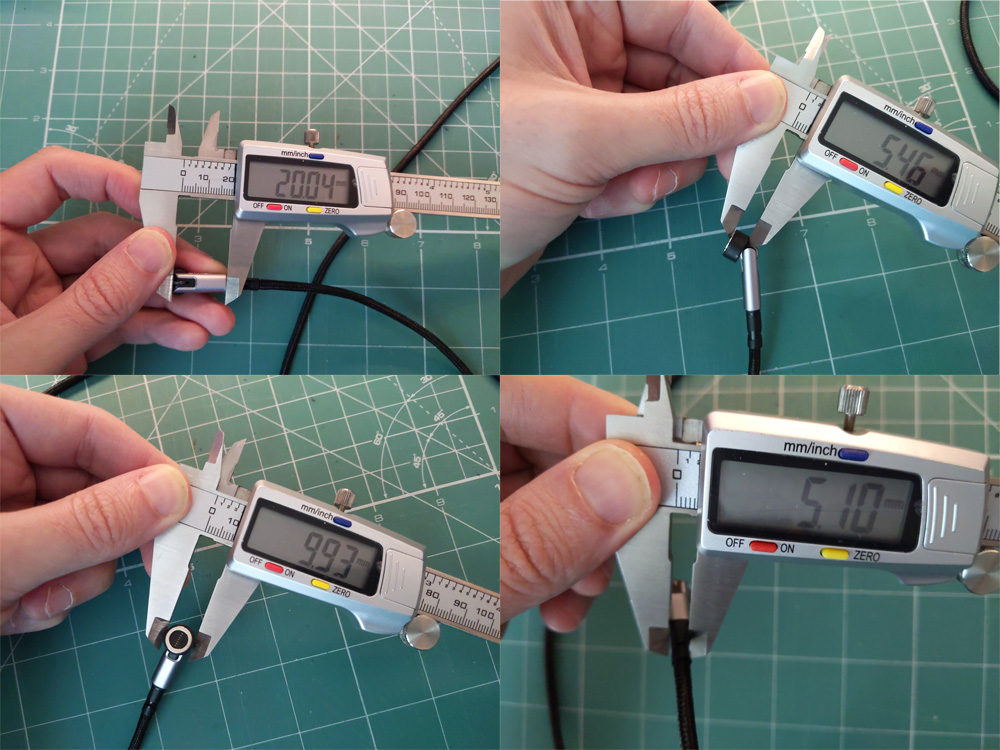
<p>As usual the design process started with taking a bunch of measurements of the cable and phone:</p>

<p><img src="/content/2022/2022-01-16-google-pixel-3axl-stand/measurements.jpg" alt="" class="img-fluid" /></p>

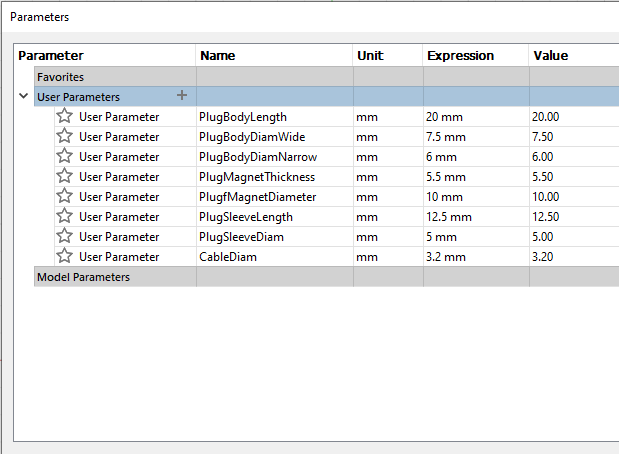
<p>These measurements then were defined as parameters in Fusion360:</p>

<p><img src="/content/2022/2022-01-16-google-pixel-3axl-stand/parameters.png" alt="" class="img-fluid" /></p>

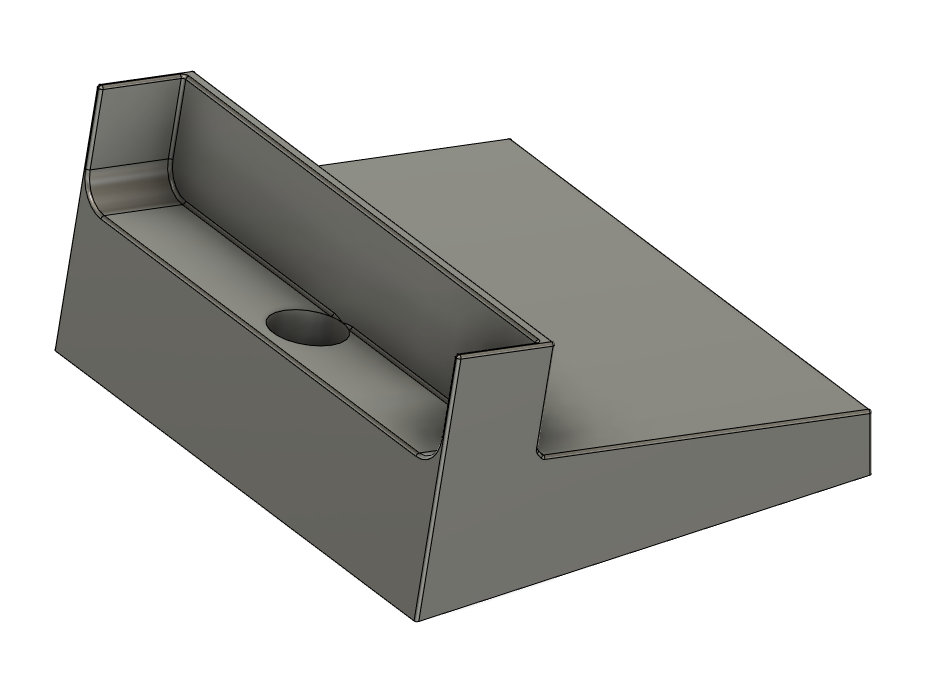
<p>The modelling process was a bit finicky because of the 10-degree angle I needed to put on the stand bed, and the various cutouts I had to make for the cable track.  The final design looked something like this:</p>

<p><img src="/content/2022/2022-01-16-google-pixel-3axl-stand/final_stand.png" alt="" class="img-fluid" /></p>

<p>Finally here’s the print in white PLA with 20% infill:</p>

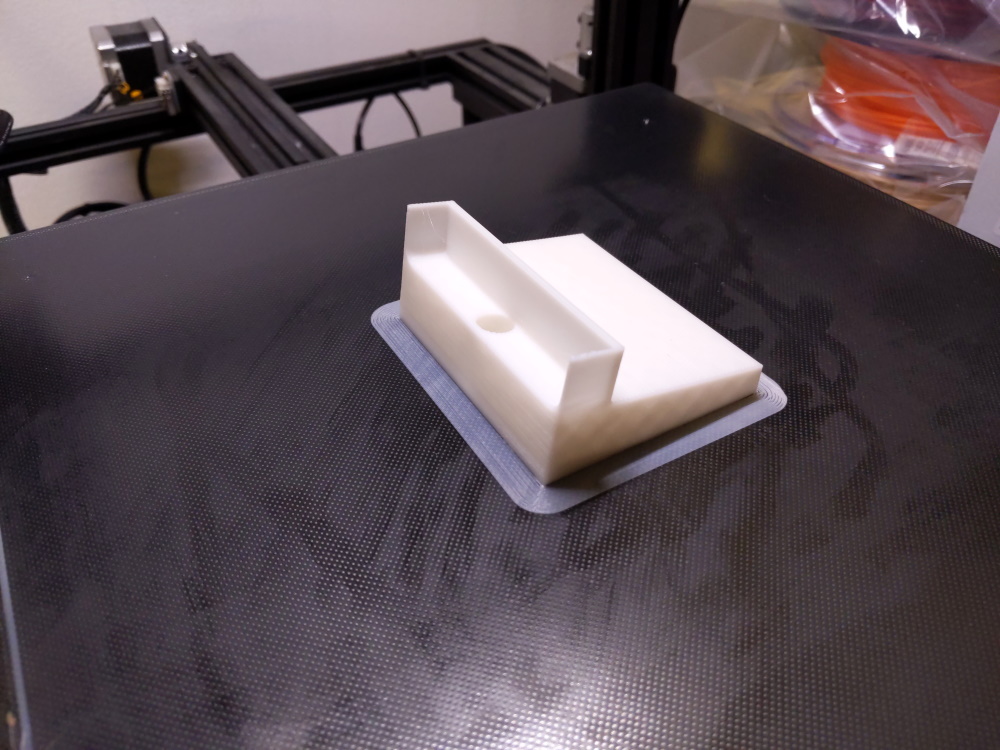
<p><img src="/content/2022/2022-01-16-google-pixel-3axl-stand/IMG_20220116_211739.jpg" alt="" class="img-fluid" /></p>

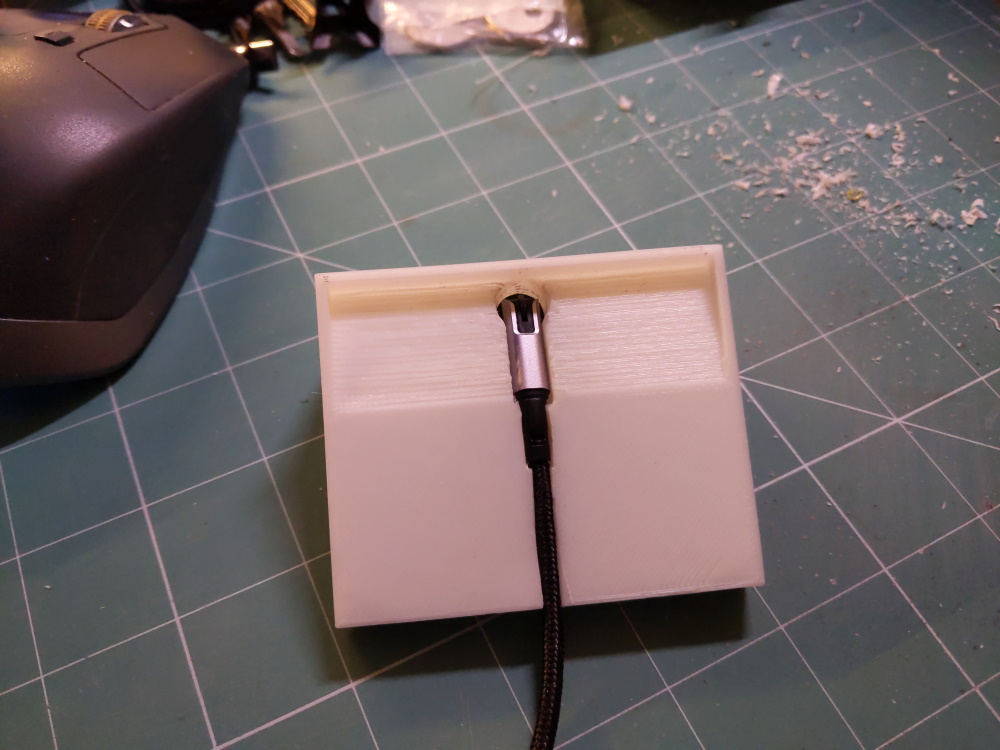
<p>The tolerances on the cable channel and the socket for the magnetic plug were a bit tight on the first print, but after enlarging with a blade and a power drill I got it to friction-fit snugly into place:</p>

<p><img src="/content/2022/2022-01-16-google-pixel-3axl-stand/IMG_20220116_214854.jpg" alt="" class="img-fluid" /></p>

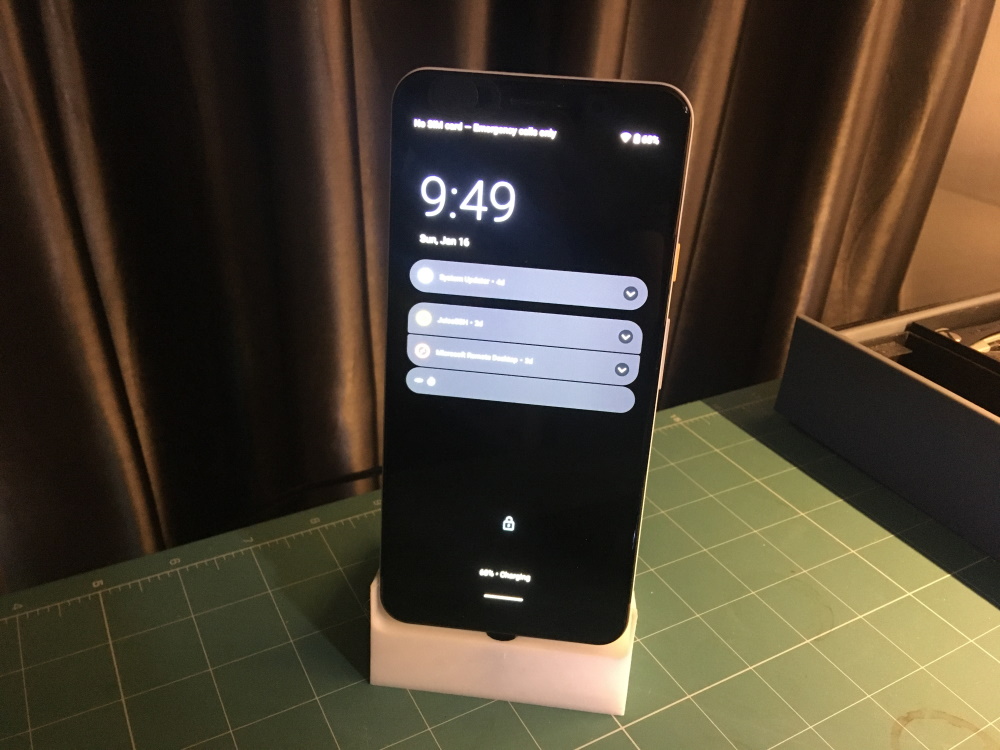
<p>Finally with the phone mounted in it:</p>

<p><img src="/content/2022/2022-01-16-google-pixel-3axl-stand/IMG_1948.JPG" alt="" class="img-fluid" /></p>

<p>The design came out great.  The only issue is the base is very light given the small amount of plastic, so when you grab the phone the whole stand comes with it.  Actually I had the same problem with my official Apple phone stand for my iPhone and just solved it with Blutac (of course) so I’ll probably do the same here.</p>]]></content><author><name></name></author><category term="gear" /><category term="3dprinting" /><category term="jekyll_post" /><summary type="html"><![CDATA[I’ve been playing with alternative phone platforms on and off for a few months now and I’m pretty much ready to make my Google Pixel 3A XL running GrapheneOS my daily driver, so I need a couple of stands for it - one for my bedside and one for my desk.]]></summary></entry><entry><title type="html">Librespeed Prometheus Exporter</title><link href="https://brendonmatheson.com/2021/11/28/librespeed-prometheus-exporter.html" rel="alternate" type="text/html" title="Librespeed Prometheus Exporter" /><published>2021-11-28T15:22:00+00:00</published><updated>2021-11-28T15:22:00+00:00</updated><id>https://brendonmatheson.com/2021/11/28/librespeed-prometheus-exporter</id><content type="html" xml:base="https://brendonmatheson.com/2021/11/28/librespeed-prometheus-exporter.html"><![CDATA[<p>This weekend I put together a Prometheus exporter to wrap the <a href="https://github.com/librespeed/speedtest-cli">librespeed-cli</a>.  This is an alternative to the <a href="/2020/08/22/speedtest-multiple-servers-in-prometheus-grafana-dashboard.html">Ookla speedtest-cli</a> which I’ve been using until now with the advantages that it is open-source, and you can run your own private speedtest servers using the companion <a href="https://github.com/librespeed/speedtest">librespeed / speedtest project</a>.</p>

<p>The sources are available under the Apache License 2.0 from the <a href="https://github.com/brendonmatheson/prometheus-librespeed-exporter">GitHub project</a> and a pre-built Docker image supporting armv7 and amd64 architectures is available from <a href="https://hub.docker.com/r/brendonmatheson/prometheus-librespeed-exporter">Docker Hub</a>.</p>

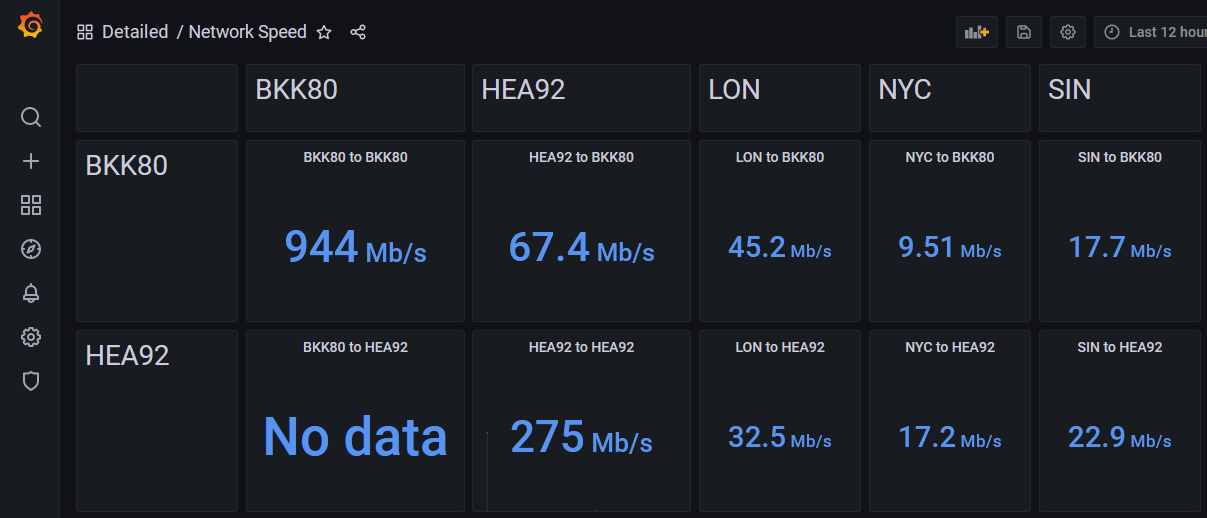
<p>So far I’m using this in my homelab to measure transfer speeds between my two sites (BKK80 and HEA92) and from public servers in London, New York and Singapore to my two sites:</p>

<p><img src="/content/2021/2021-11-28-librespeed-prometheus-exporter/dashboard.png" alt="" class="img-fluid" /></p>]]></content><author><name></name></author><category term="infrastructure" /><category term="observability" /><summary type="html"><![CDATA[This weekend I put together a Prometheus exporter to wrap the librespeed-cli. This is an alternative to the Ookla speedtest-cli which I’ve been using until now with the advantages that it is open-source, and you can run your own private speedtest servers using the companion librespeed / speedtest project.]]></summary></entry><entry><title type="html">A Prometheus Exporter for 52pi UPS Boards</title><link href="https://brendonmatheson.com/2021/07/10/piups_exporter.html" rel="alternate" type="text/html" title="A Prometheus Exporter for 52pi UPS Boards" /><published>2021-07-10T18:27:00+00:00</published><updated>2021-07-10T18:27:00+00:00</updated><id>https://brendonmatheson.com/2021/07/10/piups_exporter</id><content type="html" xml:base="https://brendonmatheson.com/2021/07/10/piups_exporter.html"><![CDATA[<p>I’m waiting for a final part (specifically 10 meters of four-core telephone cable) so that I can continue my weather station build, but one part that has finally arrived is the replacement UPS board.  I got a <a href="https://wiki.52pi.com/index.php/UPS_(With_RTC_%26_Coulometer)_For_Raspberry_Pi_SKU:_EP-0118">52pi EP-0118 EPS “UPS with RTC and Coulometer”</a>.</p>

<p>The install was uneventful and went according to the documentation so there’s nothing much to add there.</p>

<p>Their docs provide a sample Python script for reading the energy values via the I2C bus and this was also easy to get going.  After getting the sample running I decided to put together a Prometheus exporter based on the <a href="https://github.com/ricoberger/script_exporter">script_exporter by Rico Berger</a>.  This is fully working now:</p>

<div class="language-bash highlighter-rouge"><div class="highlight"><pre class="highlight"><code>curl http://localhost:9469/probe?script<span class="o">=</span>piups

<span class="c"># HELP script_success Script exit status (0 = error, 1 = success).</span>
<span class="c"># TYPE script_success gauge</span>
script_success<span class="o">{</span><span class="nv">script</span><span class="o">=</span><span class="s2">"piups"</span><span class="o">}</span> 1
<span class="c"># HELP script_duration_seconds Script execution time, in seconds.</span>
<span class="c"># TYPE script_duration_seconds gauge</span>
script_duration_seconds<span class="o">{</span><span class="nv">script</span><span class="o">=</span><span class="s2">"piups"</span><span class="o">}</span> 0.280330
<span class="c"># HELP piups_bus_voltage_volts The voltage supplied to the connected device(s)</span>
<span class="c"># TYPE piups_bus_voltage_volts gauge</span>
piups_bus_voltage_volts 5.208
<span class="c"># HELP piups_bus_current_milliamps The current drawn by the connected device(s)</span>
<span class="c"># TYPE piups_bus_current_milliamps gauge</span>
piups_bus_current_milliamps 136.805
<span class="c"># HELP piups_power_milliwatts The power consumed by the connected devices in milli-watts</span>
<span class="c"># TYPE piups_power_milliwatts gauge</span>
piups_power_milliwatts 737.561
<span class="c"># HELP piups_shunt_voltage_millivolts TBD</span>
<span class="c"># TYPE piups_shunt_voltage_millivolts gauge</span>
piups_shunt_voltage_millivolts 7.080
</code></pre></div></div>

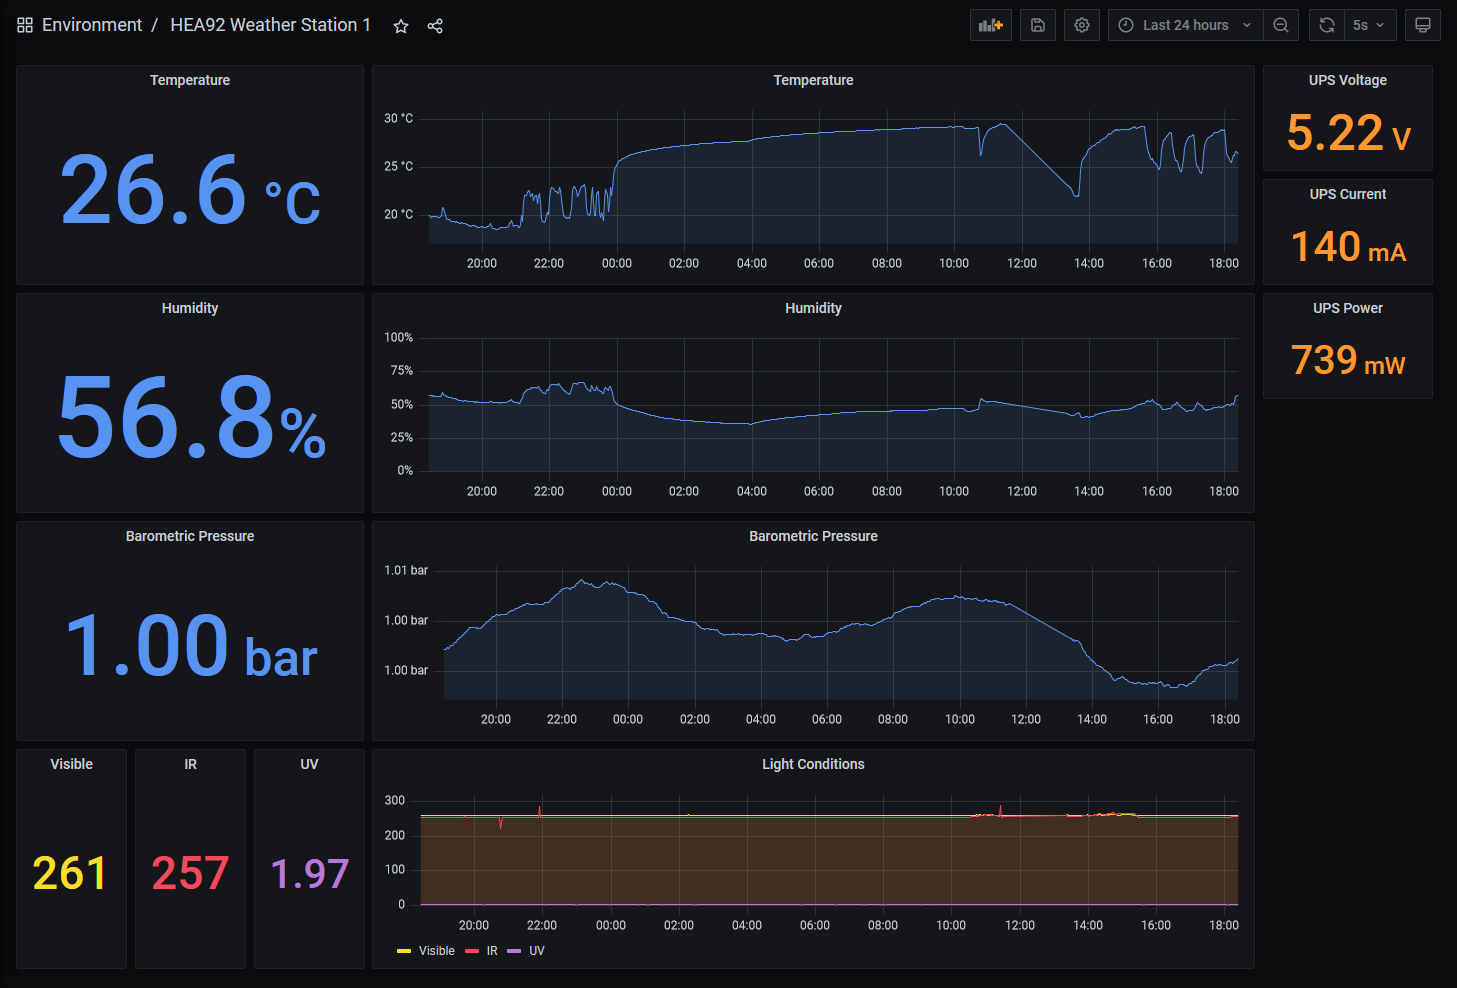
<p>In my weather station dashboard I’ve added a side-bar showing the energy consumption of the station as queried every 15 seconds from the UPS board:</p>

<p><img src="/content/2021/2021-07-10-piups_exporter/grafana.png" alt="" class="img-fluid" /></p>

<p>I have packaged my solution as <a href="https://github.com/brendonmatheson/piups_exporter">piups_exporter on GitHub</a> and the README in that project elaborates on how to get it setup, which is very easy.</p>

<p>It was only after I got my UPS board that I realized there’s a newer model than the one that I ordered - the <a href="https://wiki.52pi.com/index.php/UPS_Plus_SKU:_EP-0136">EP-0136 “UPS Plus”</a> which provides a lot more metrics - so naturally I’ve ordered one of those and once I have it I will come back and update piups_exporter to also ship those metrics.</p>]]></content><author><name></name></author><category term="observability" /><category term="opensource" /><category term="iot" /><summary type="html"><![CDATA[I’m waiting for a final part (specifically 10 meters of four-core telephone cable) so that I can continue my weather station build, but one part that has finally arrived is the replacement UPS board. I got a 52pi EP-0118 EPS “UPS with RTC and Coulometer”.]]></summary></entry><entry><title type="html">Weather Station v2</title><link href="https://brendonmatheson.com/2021/06/05/weather-station-v2.html" rel="alternate" type="text/html" title="Weather Station v2" /><published>2021-06-05T09:55:00+00:00</published><updated>2021-06-05T09:55:00+00:00</updated><id>https://brendonmatheson.com/2021/06/05/weather-station-v2</id><content type="html" xml:base="https://brendonmatheson.com/2021/06/05/weather-station-v2.html"><![CDATA[<p>Time to catch up on the additions and improvements on the weather station since I built the <a href="/2021/05/23/weather-station-v1.html">first MVP</a>.</p>

<h1 id="hardware">Hardware</h1>

<h2 id="overview">Overview</h2>

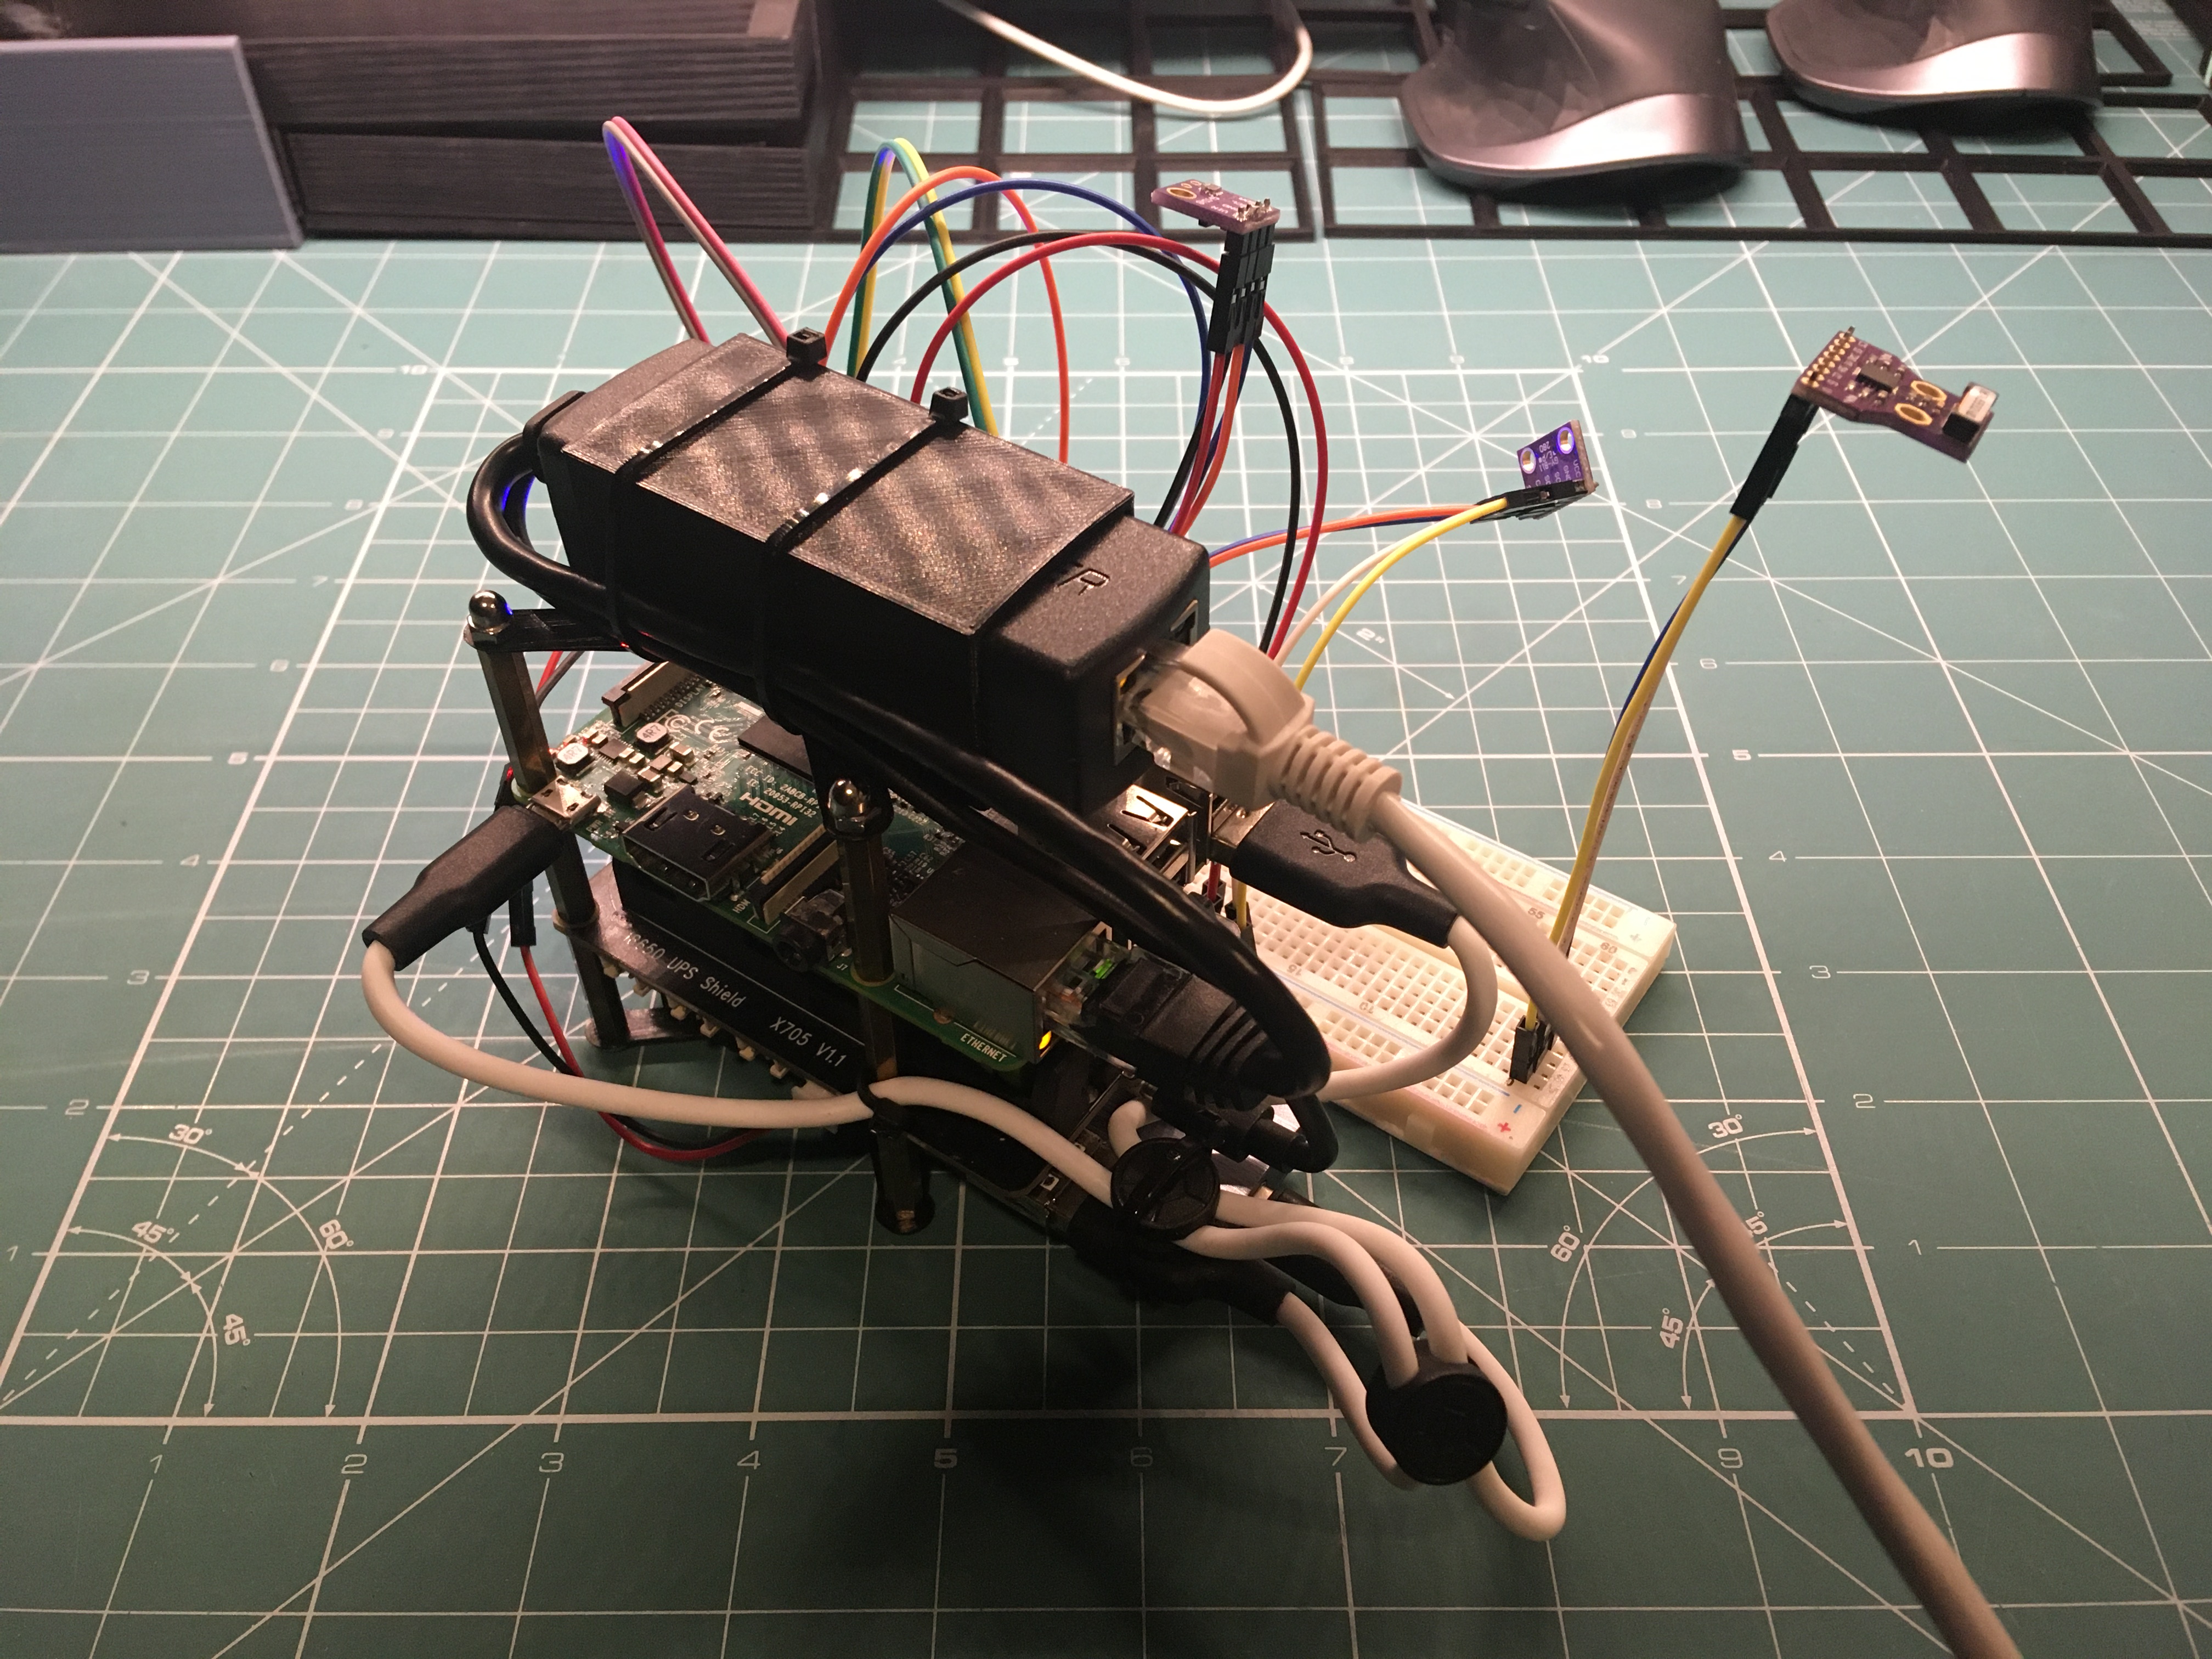
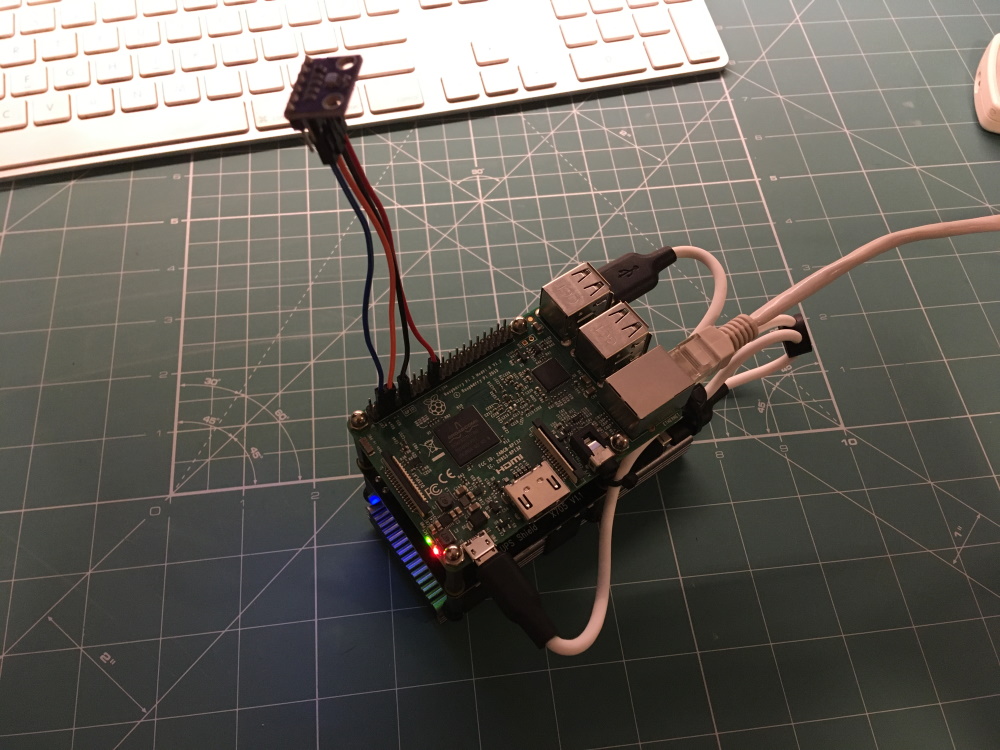
<p>So here’s what the weather station looks like currently:</p>

<p><img src="/content/2021/2021-06-03-weather-station-v2/IMG_0890.JPG" alt="" class="img-fluid" /></p>

<p>The new things are:</p>

<ul>
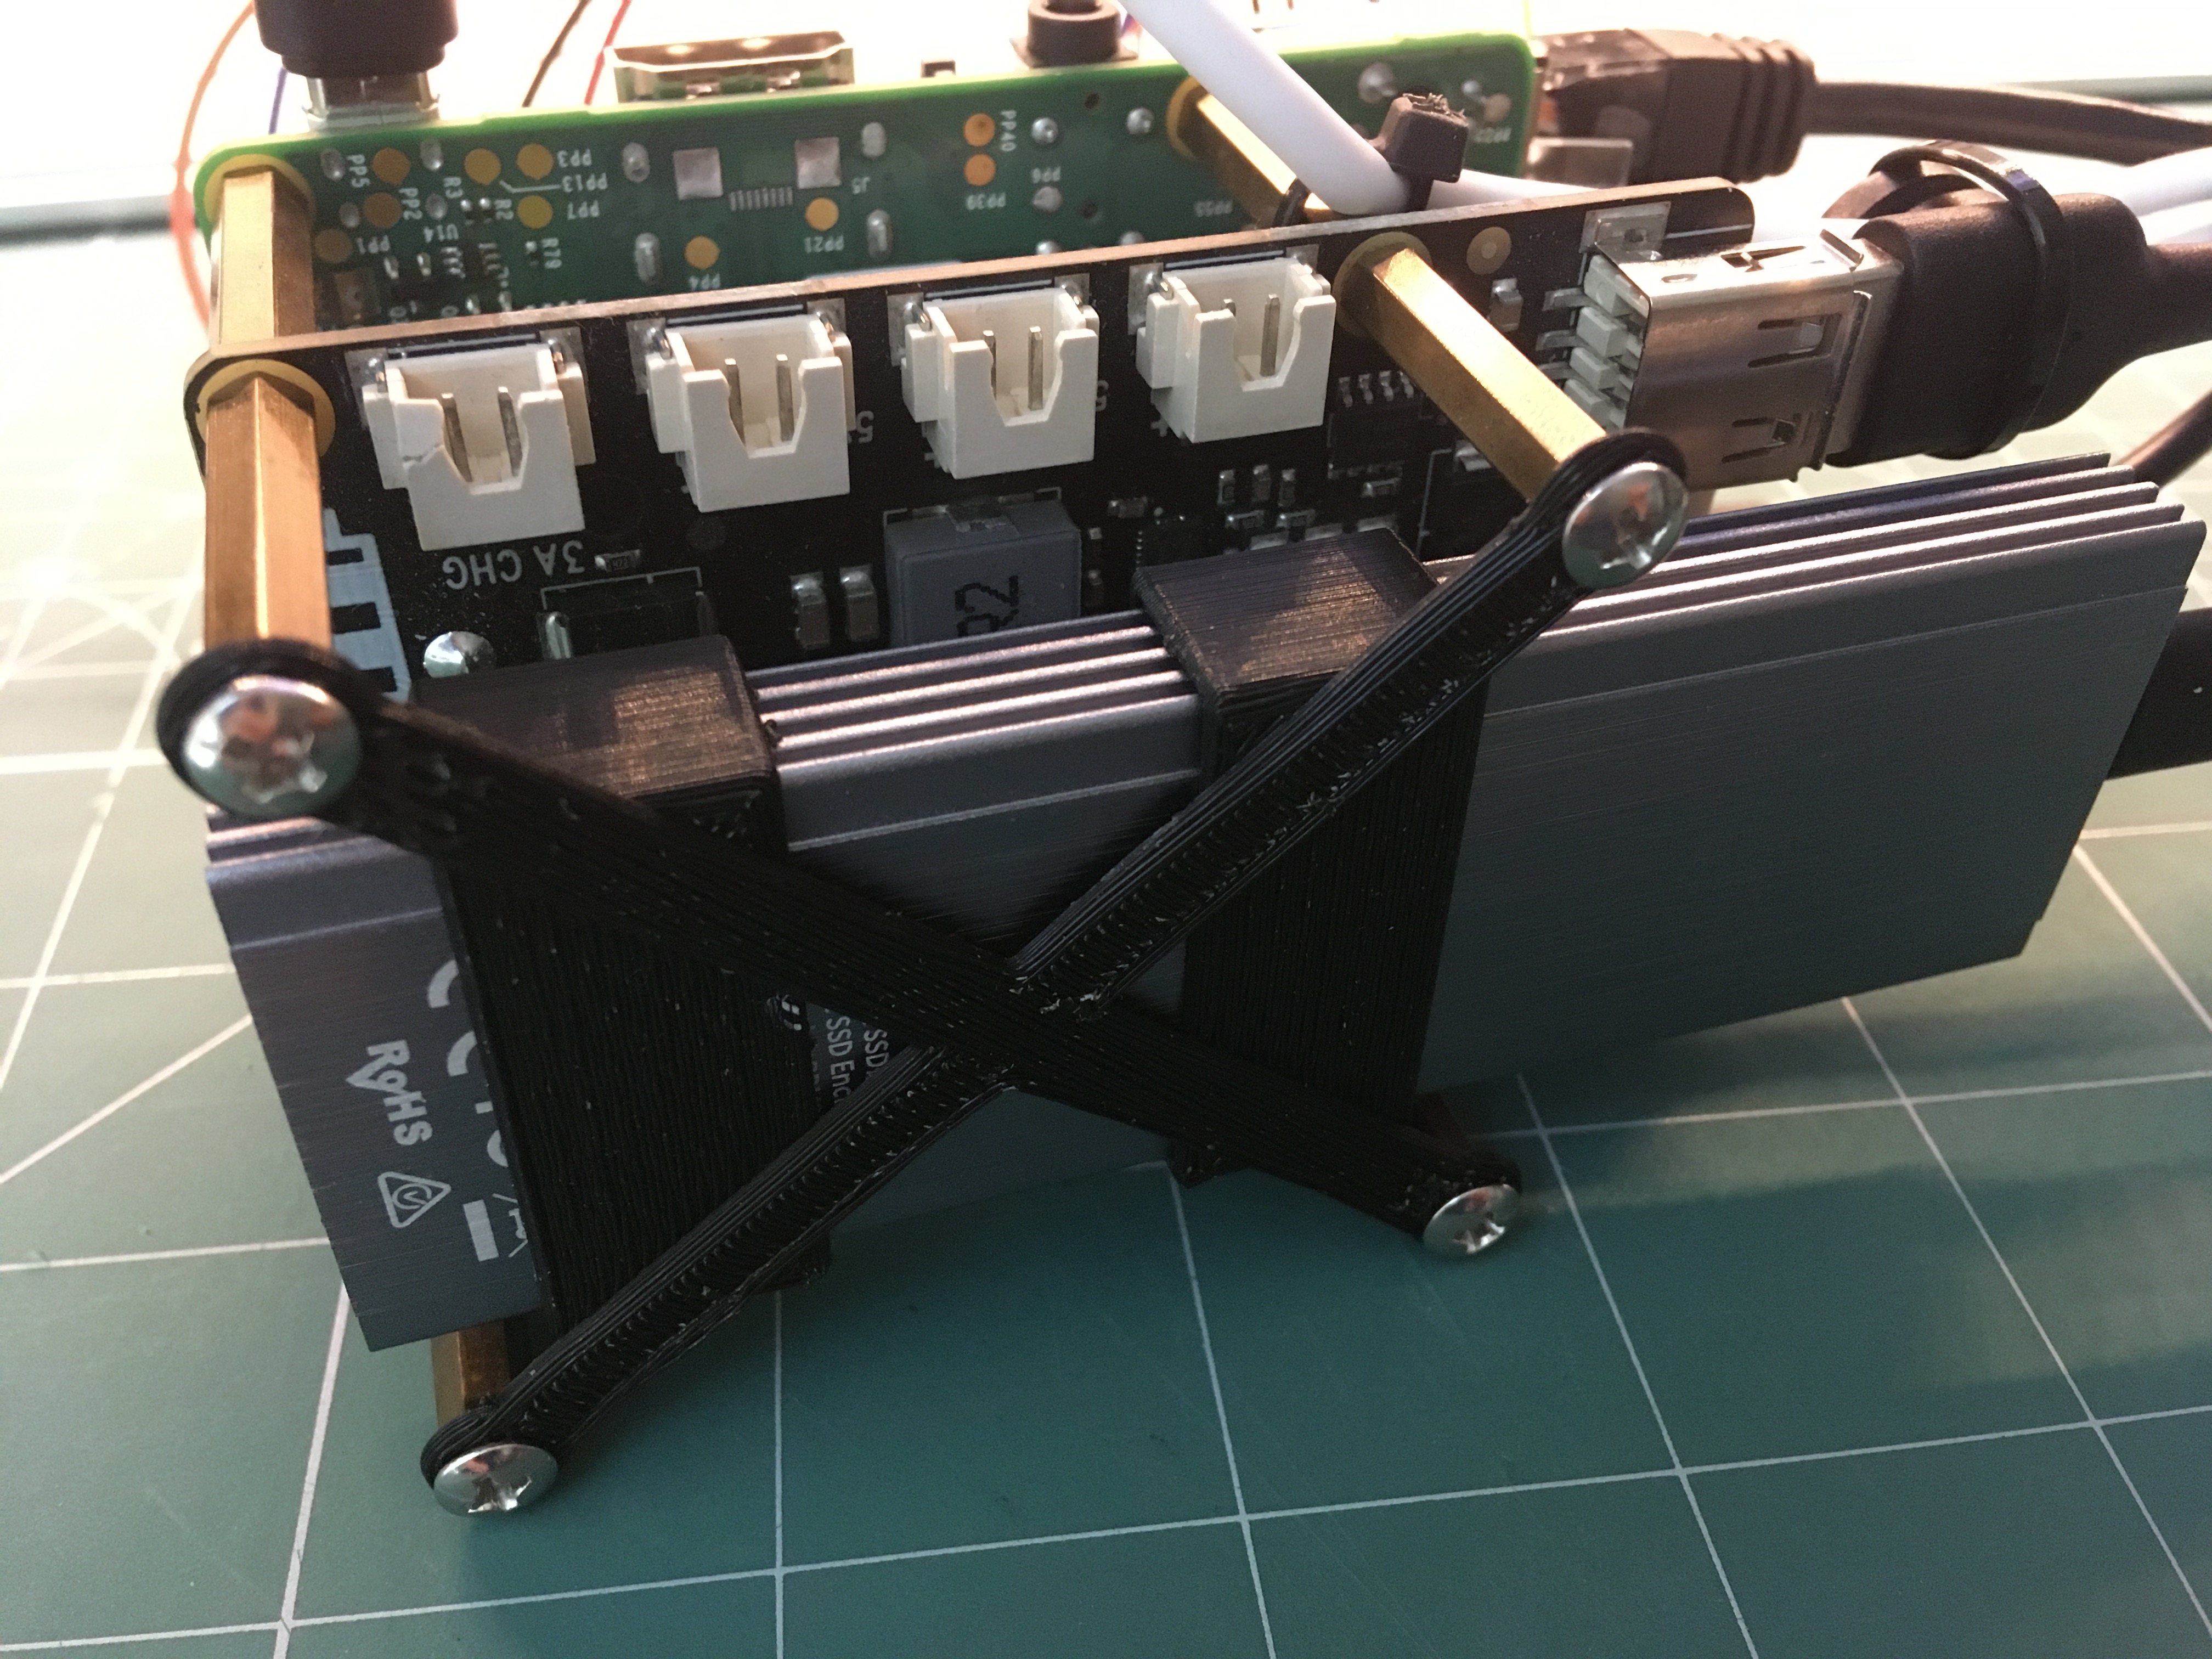
  <li>PoE+ adapter and 3D-printed mounting bracket</li>
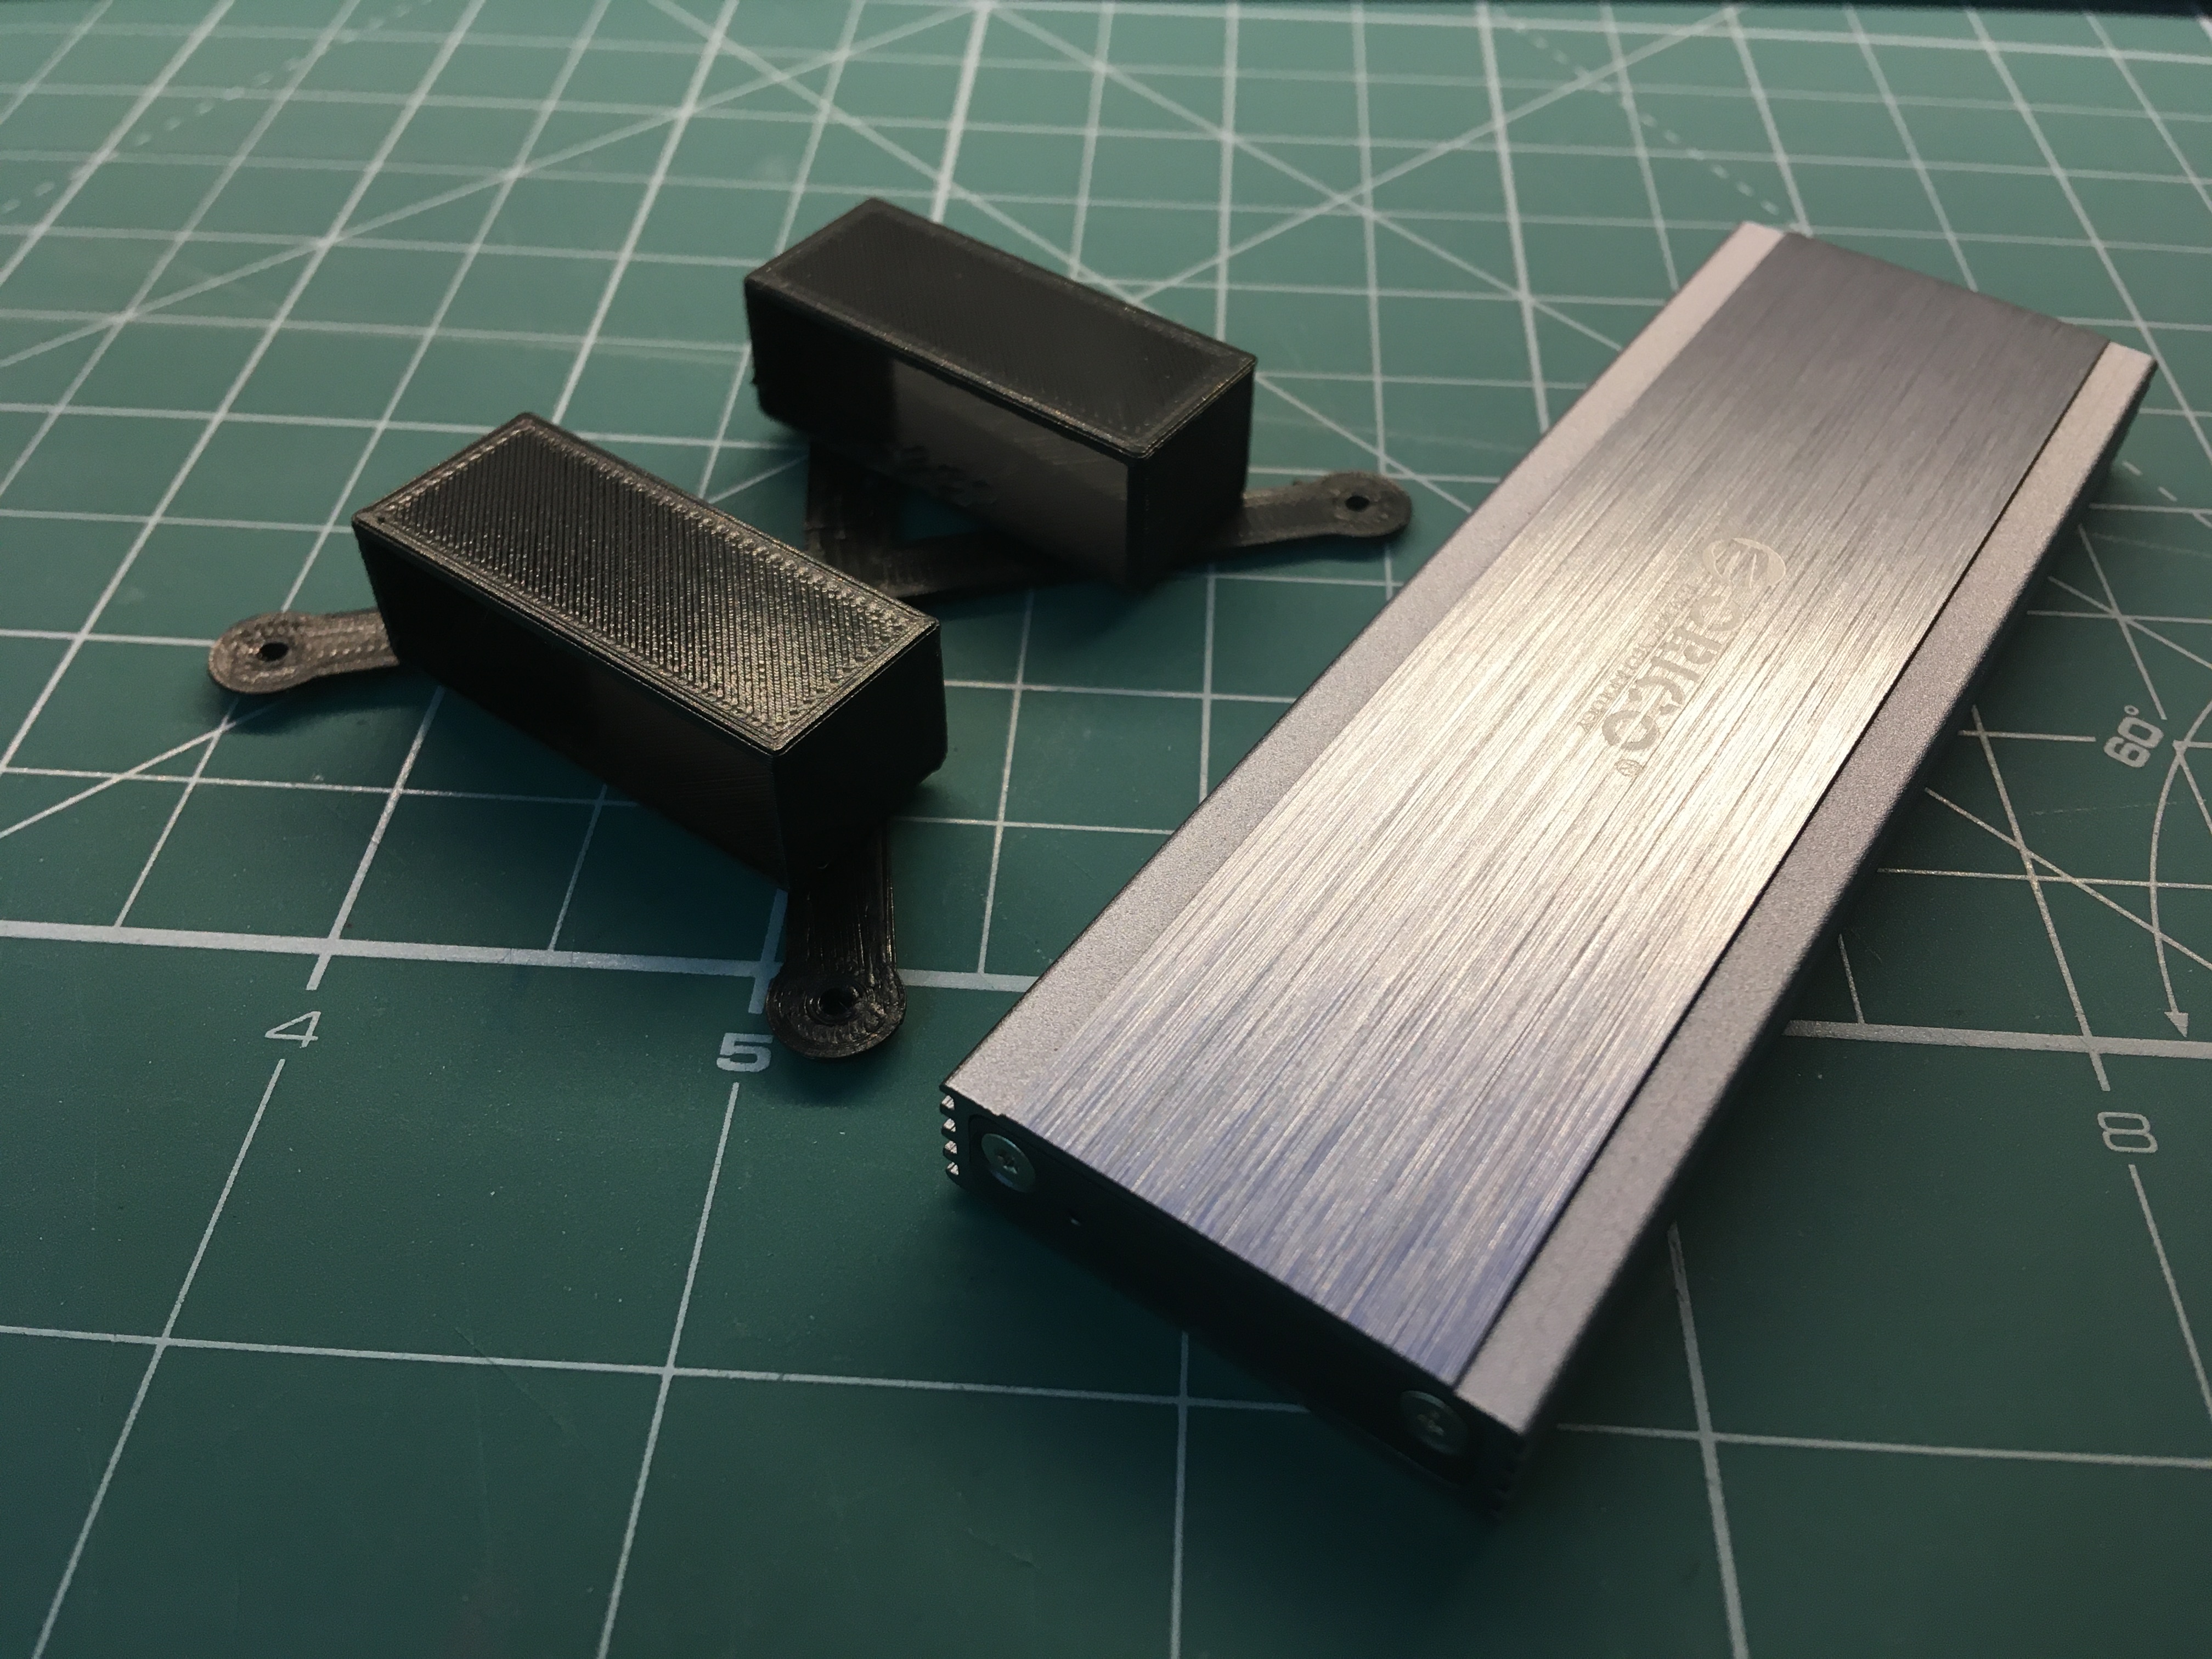
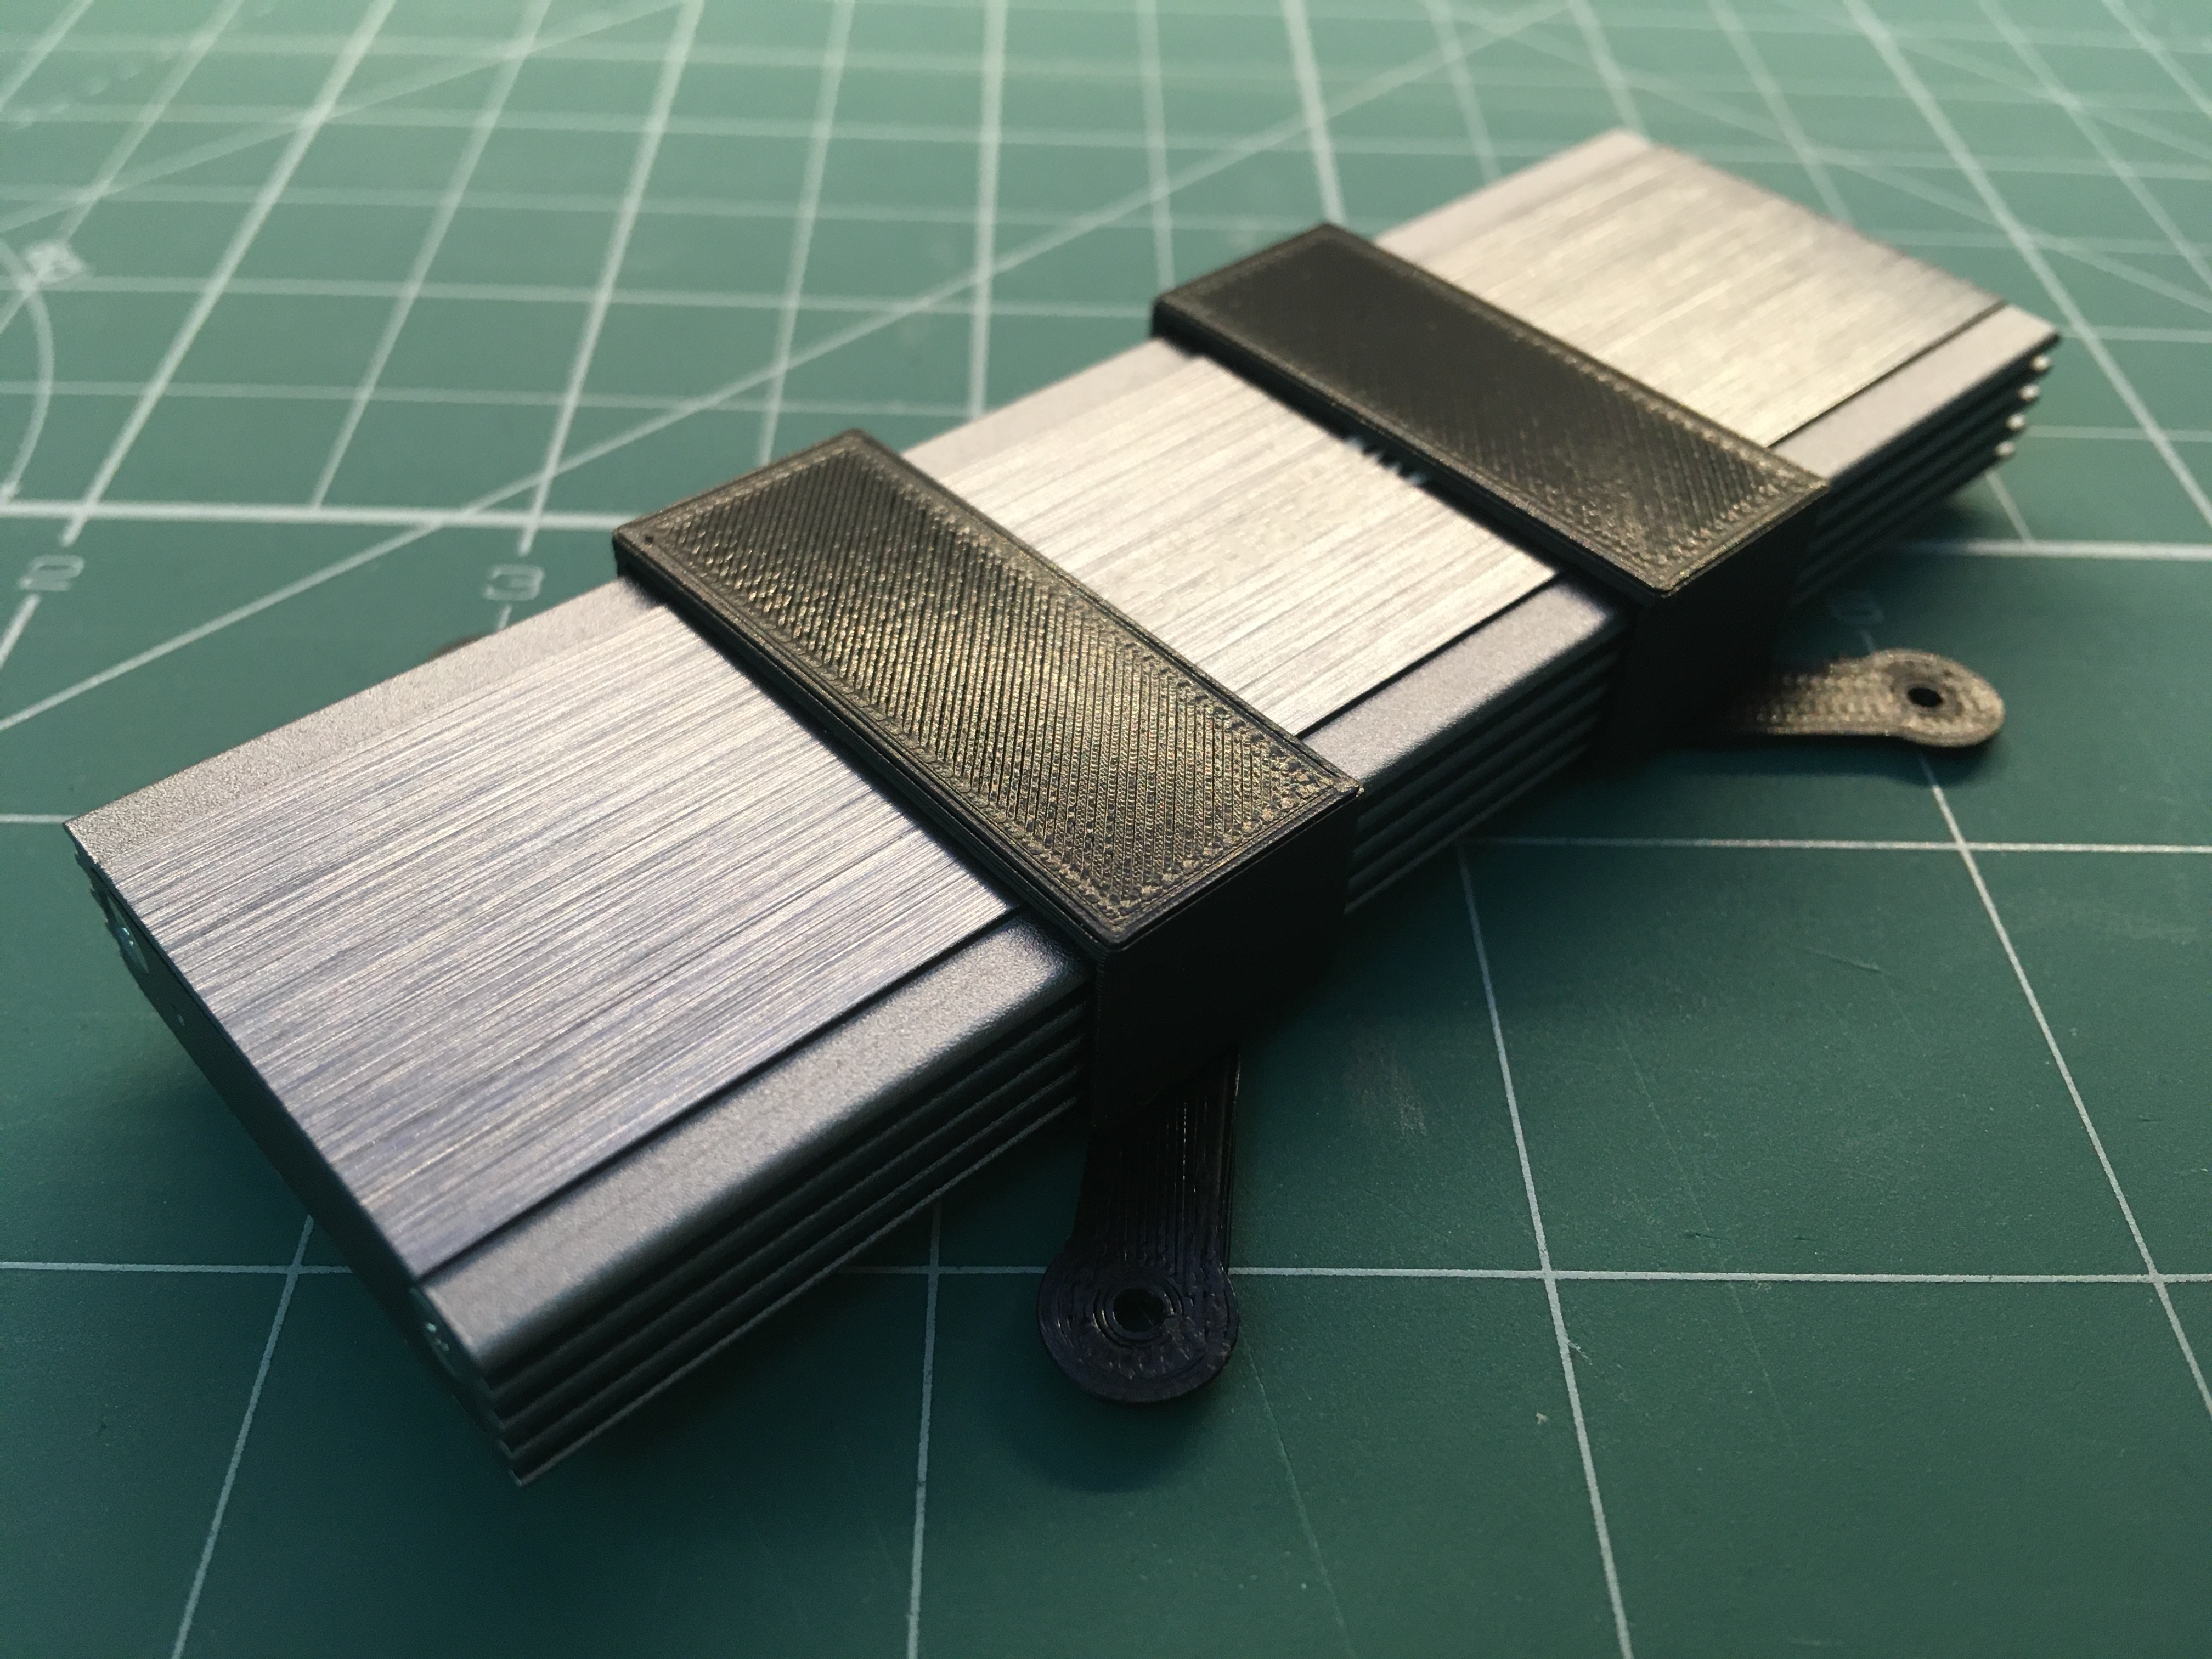
  <li>Replacement SSD enclosure and 3D-printed mounting bracket</li>
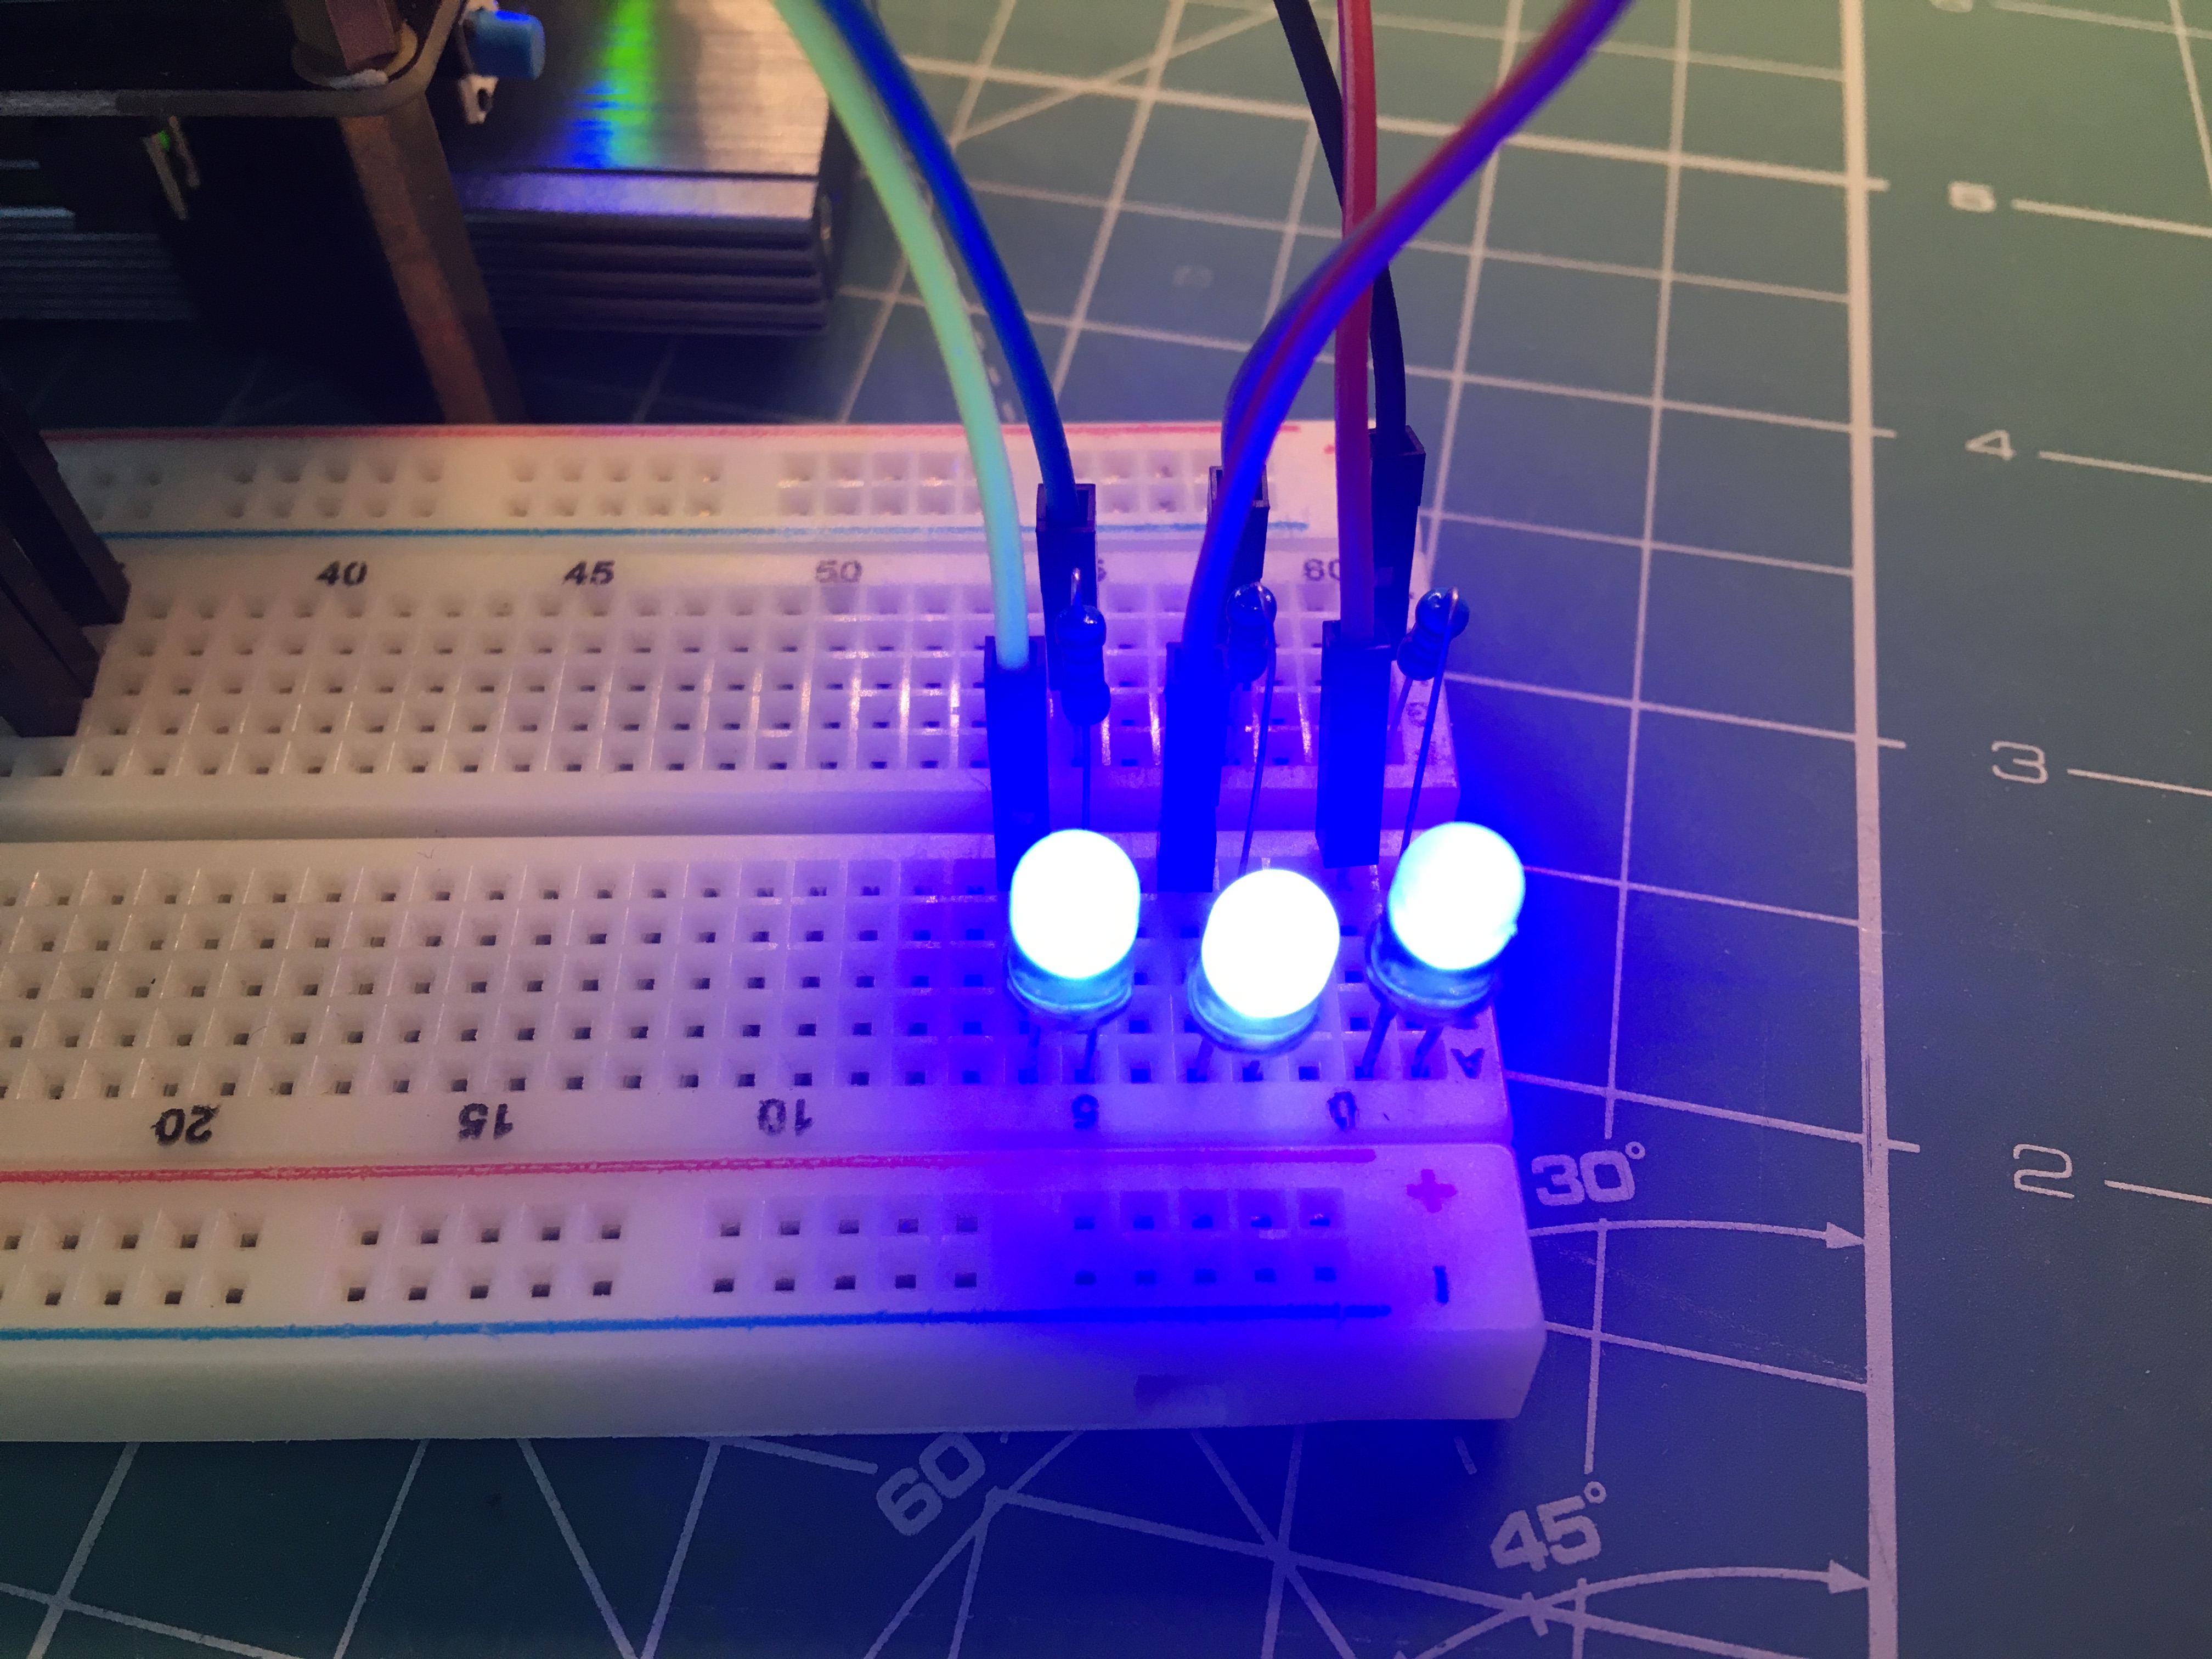
  <li>LED indicators for UPS board power, Pi power status and SSD activity</li>
  <li>SI1145 light sensor</li>
</ul>

<p>The AS3935 sensor plugged in at the right isn’t connected yet - that’s just so I don’t misplace it.</p>

<h2 id="poe-adapter">PoE+ Adapter</h2>

<p>I have a few these PoE+ adapters in my parts cabinet so I just threw one on to see what would happen with power being supplied by my <a href="https://store.ui.com/products/unifiswitch-24-250w">UniFi 24 port switch</a>.  It worked, but after about 5 days the system lost power.</p>

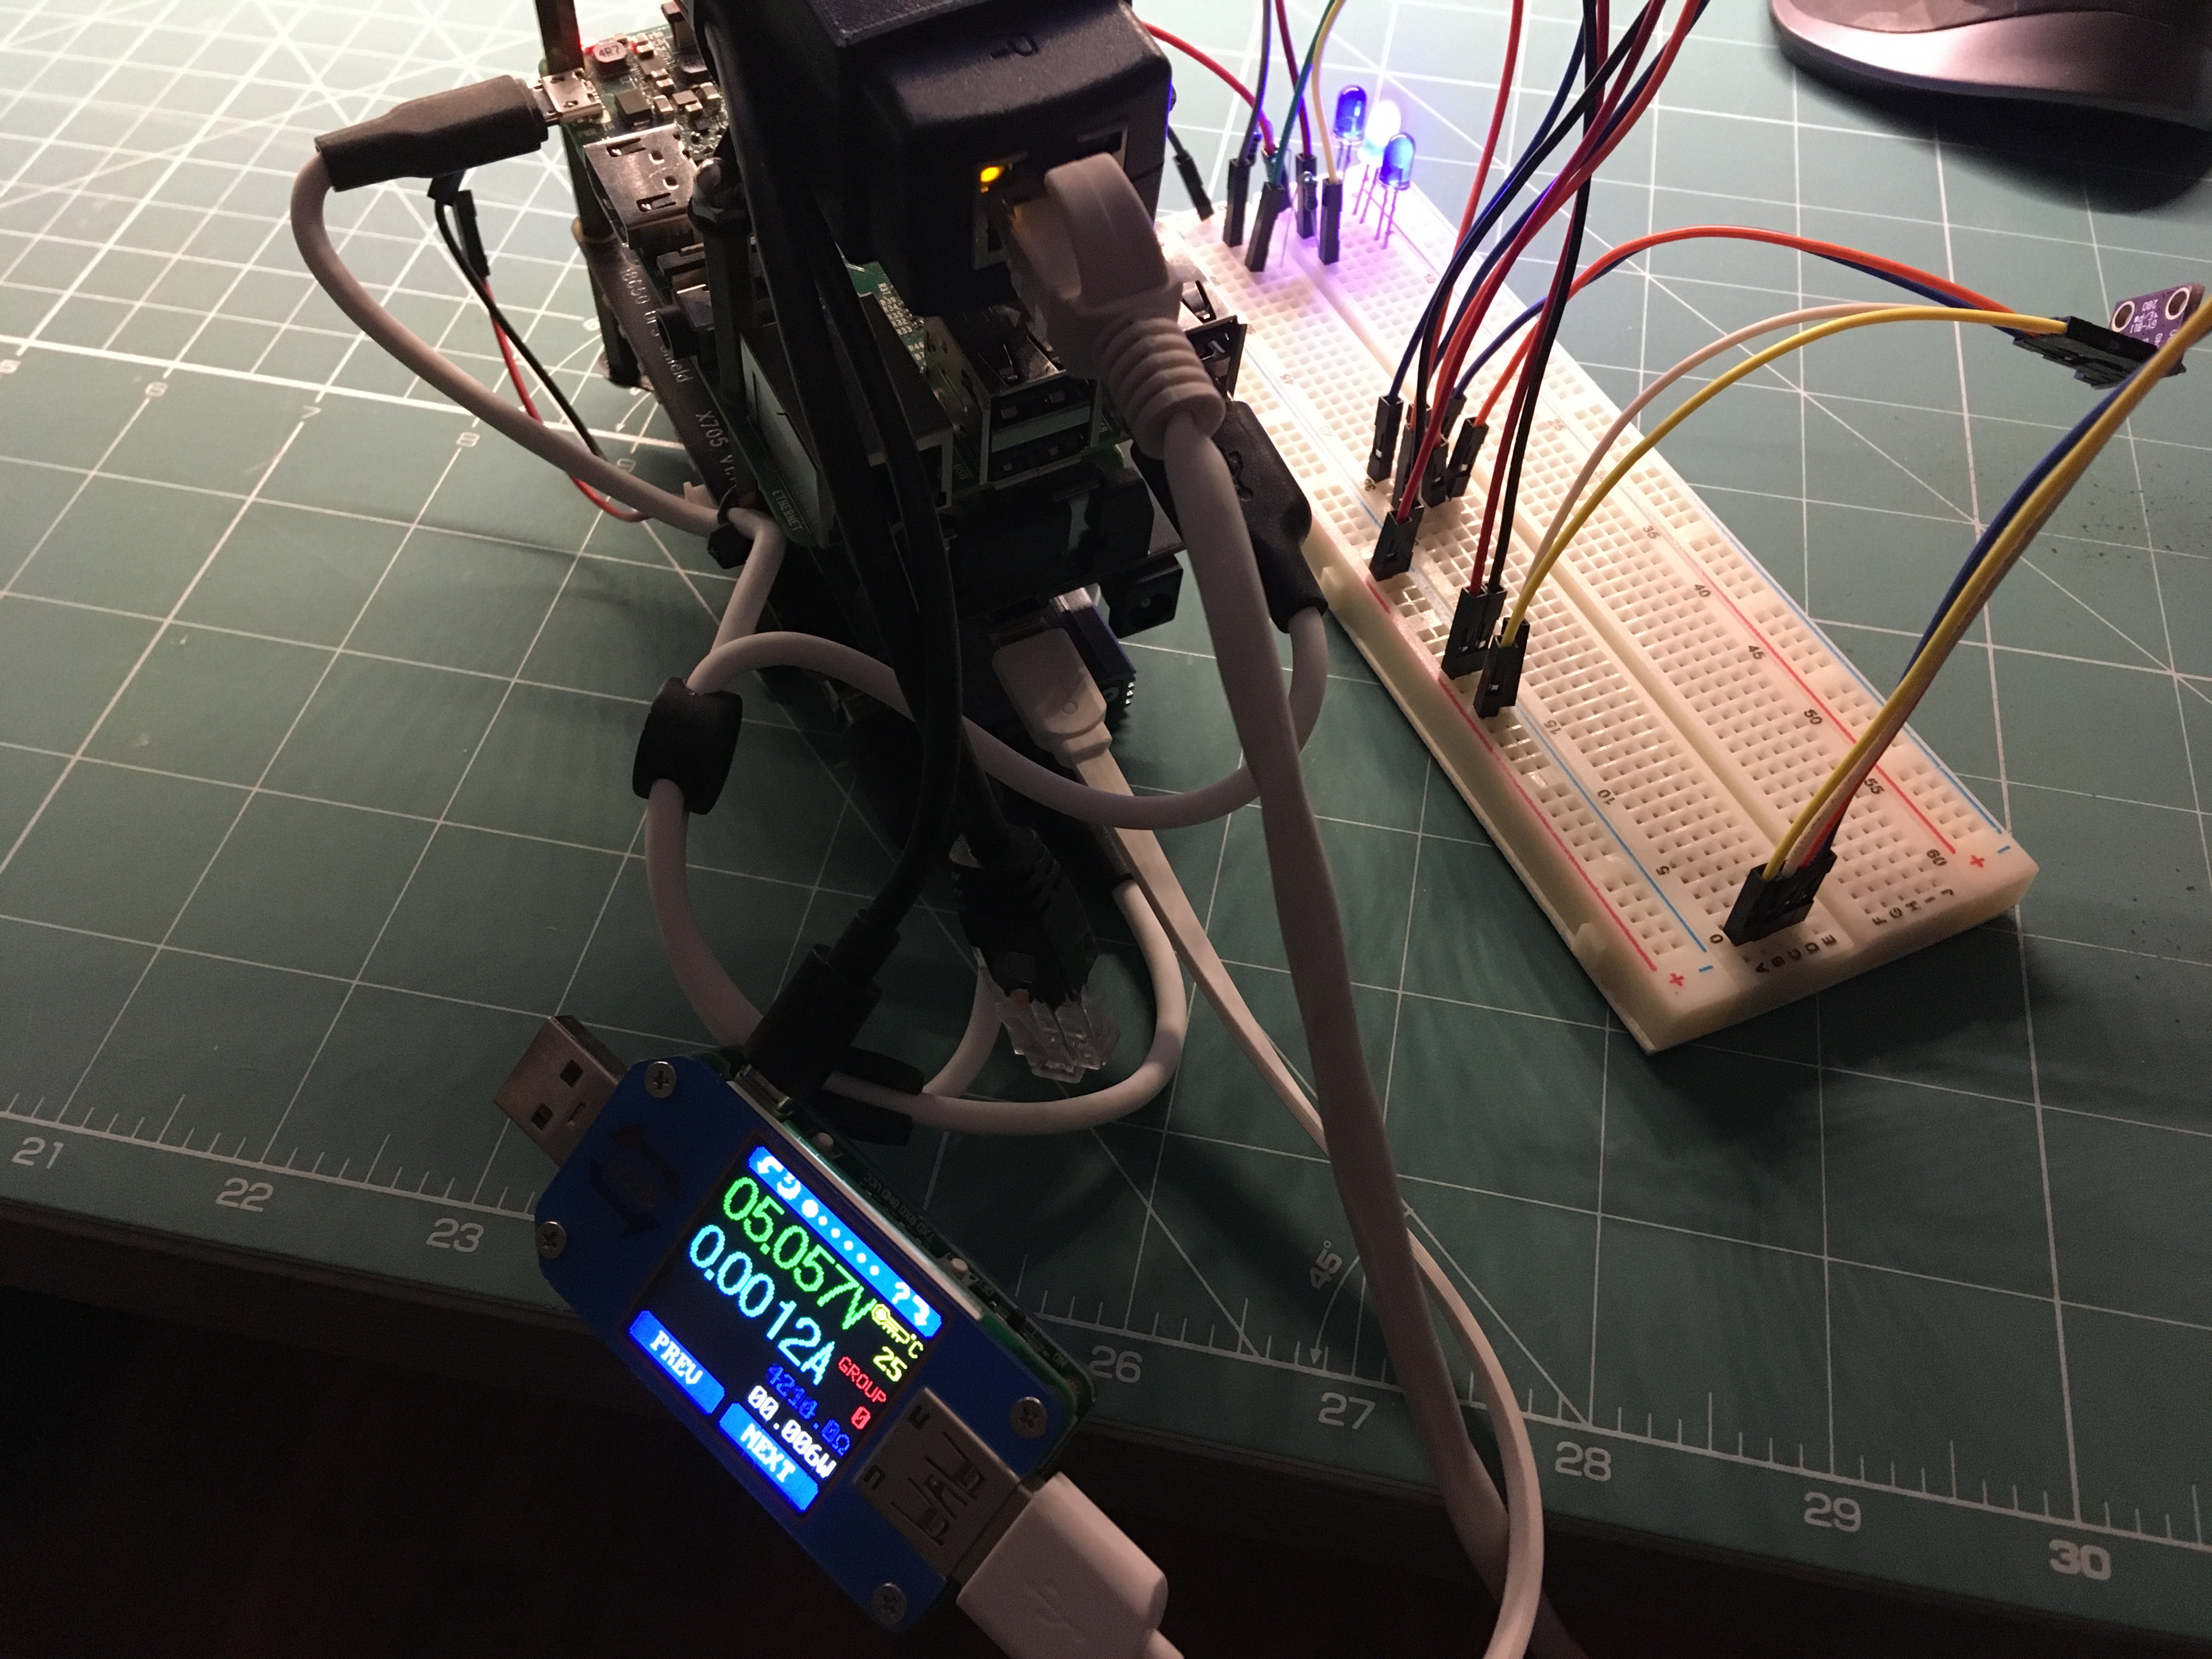
<p>After fully recharging the batteries via the barrel jack I hooked up my Ruideng USB in-line multimeter to determine that when the UPS board is already fully charged it draws about 1 milliamp from the PoE+ adapter:</p>

<p><img src="/content/2021/2021-06-03-weather-station-v2/IMG_0921.JPG" alt="" class="img-fluid" /></p>

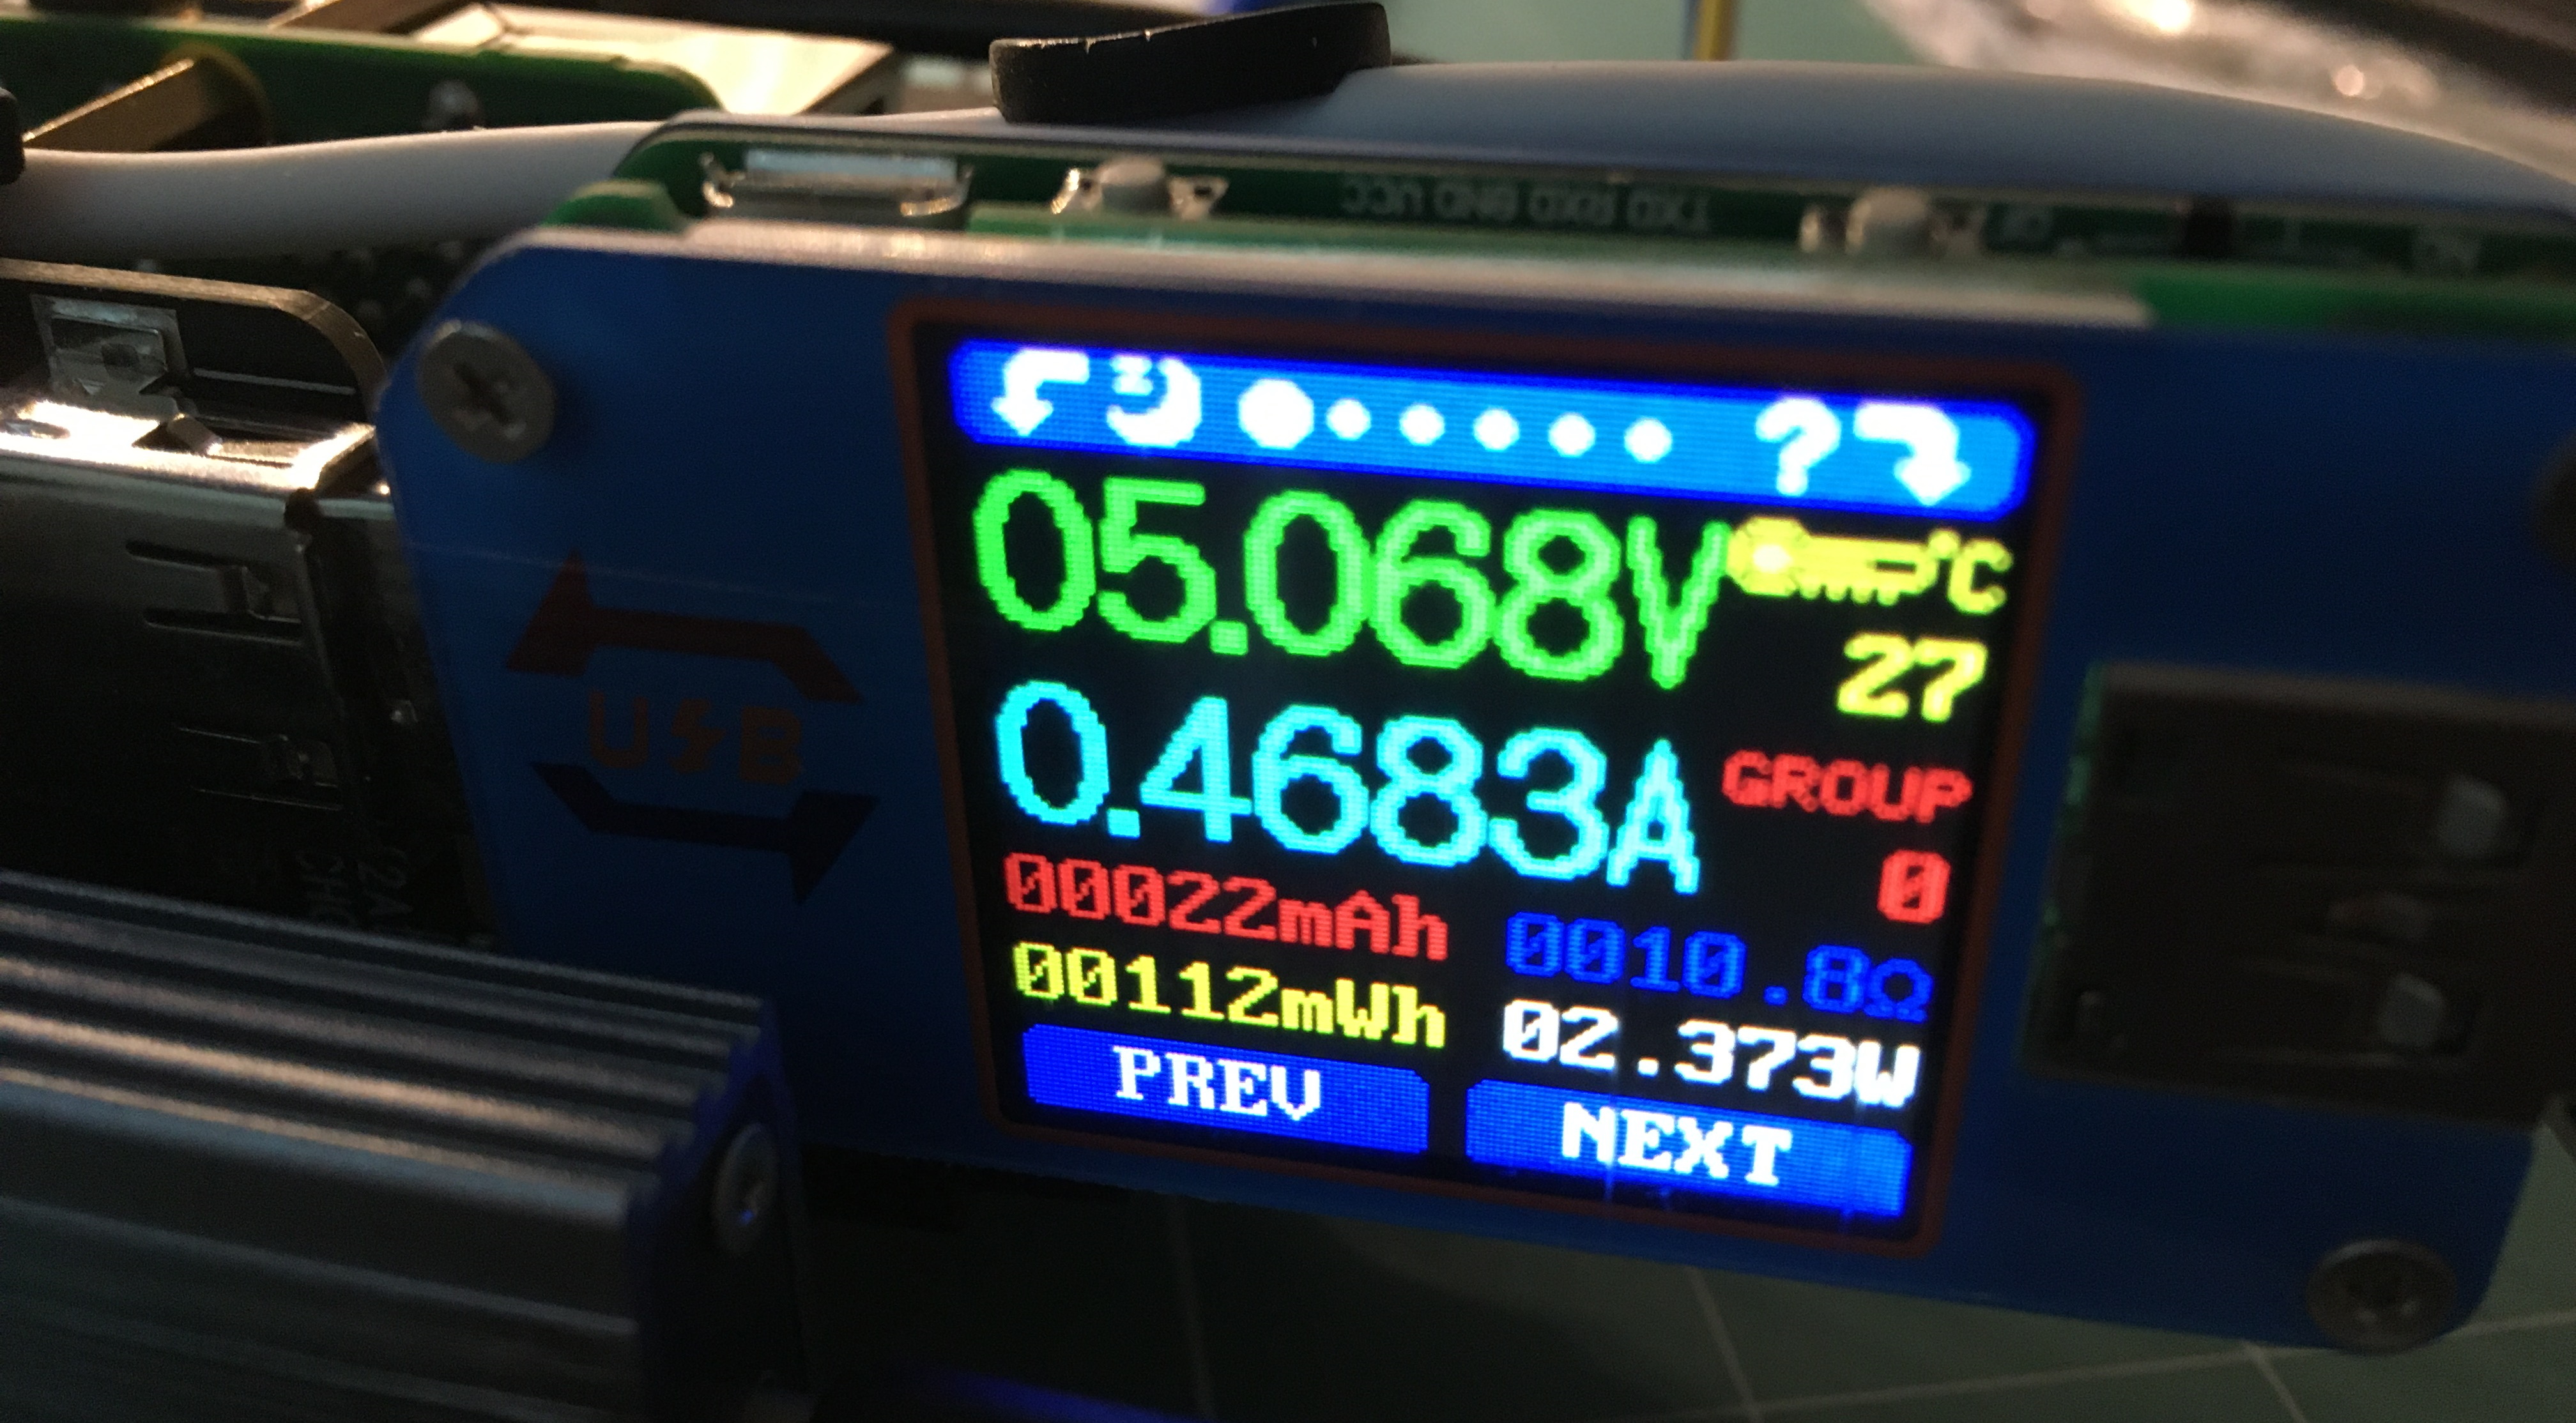
<p>Even though the Pi is running and drawing around half an amp:</p>

<p><img src="/content/2021/2021-06-03-weather-station-v2/IMG_0911.JPG" alt="" class="img-fluid" /></p>

<p>In other words the UPS is driving the board off batteries even when connected to power.  Eventually it hits a threshold and starts charging again, but apparently not effectively enough because eventually the batteries run flat and the system dies.  In short - this is not a UPS, it’s a powerbank.</p>

<p>I have ordered a <a href="https://wiki.52pi.com/index.php/UPS_(With_RTC_%26_Coulometer)_For_Raspberry_Pi_SKU:_EP-0118">52pi UPS board</a>.  I believe it’s a better unit - but it’s really hard to tell from the data sheet so has to be tested.  This board has a built-in RTC (a nice-to-have for my application) and a power meter so you can read draw and battery level via I2C which will be cool if I can get that to work.  Ideally I will read those values and export them to Prometheus.</p>

<h2 id="replacement-ssd-enclosure">Replacement SSD Enclosure</h2>

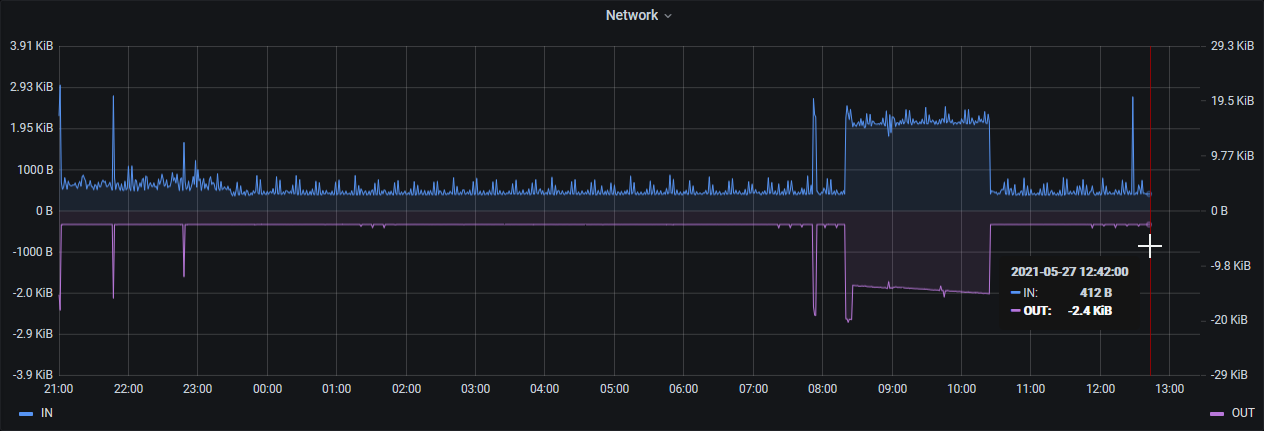
<p>On Tuesday morning last week I woke up to a dead weather station.  From the Prometheus-exported host telemetry I could see that it went offline around 2:20am local time.</p>

<p><img src="/content/2021/2021-06-03-weather-station-v2/ssd_failure.png" alt="" class="img-fluid" /></p>

<p>Through a process of elimination I determined that it was the interface board in the SSD enclosure that had failed and that the SSD itself was fine so I ordered in a new <a href="https://www.lazada.co.th/products/i2360916754-s7982440996.html">Orico brand enclosure</a>.  This one was a  different size to the original so I had to print a new bracket for it:</p>

<p><img src="/content/2021/2021-06-03-weather-station-v2/IMG_0873.JPG" alt="" class="img-fluid" /></p>

<p><img src="/content/2021/2021-06-03-weather-station-v2/IMG_0875.JPG" alt="" class="img-fluid" /></p>

<p><img src="/content/2021/2021-06-03-weather-station-v2/IMG_0876.JPG" alt="" class="img-fluid" /></p>

<h2 id="led-indicators">LED Indicators</h2>

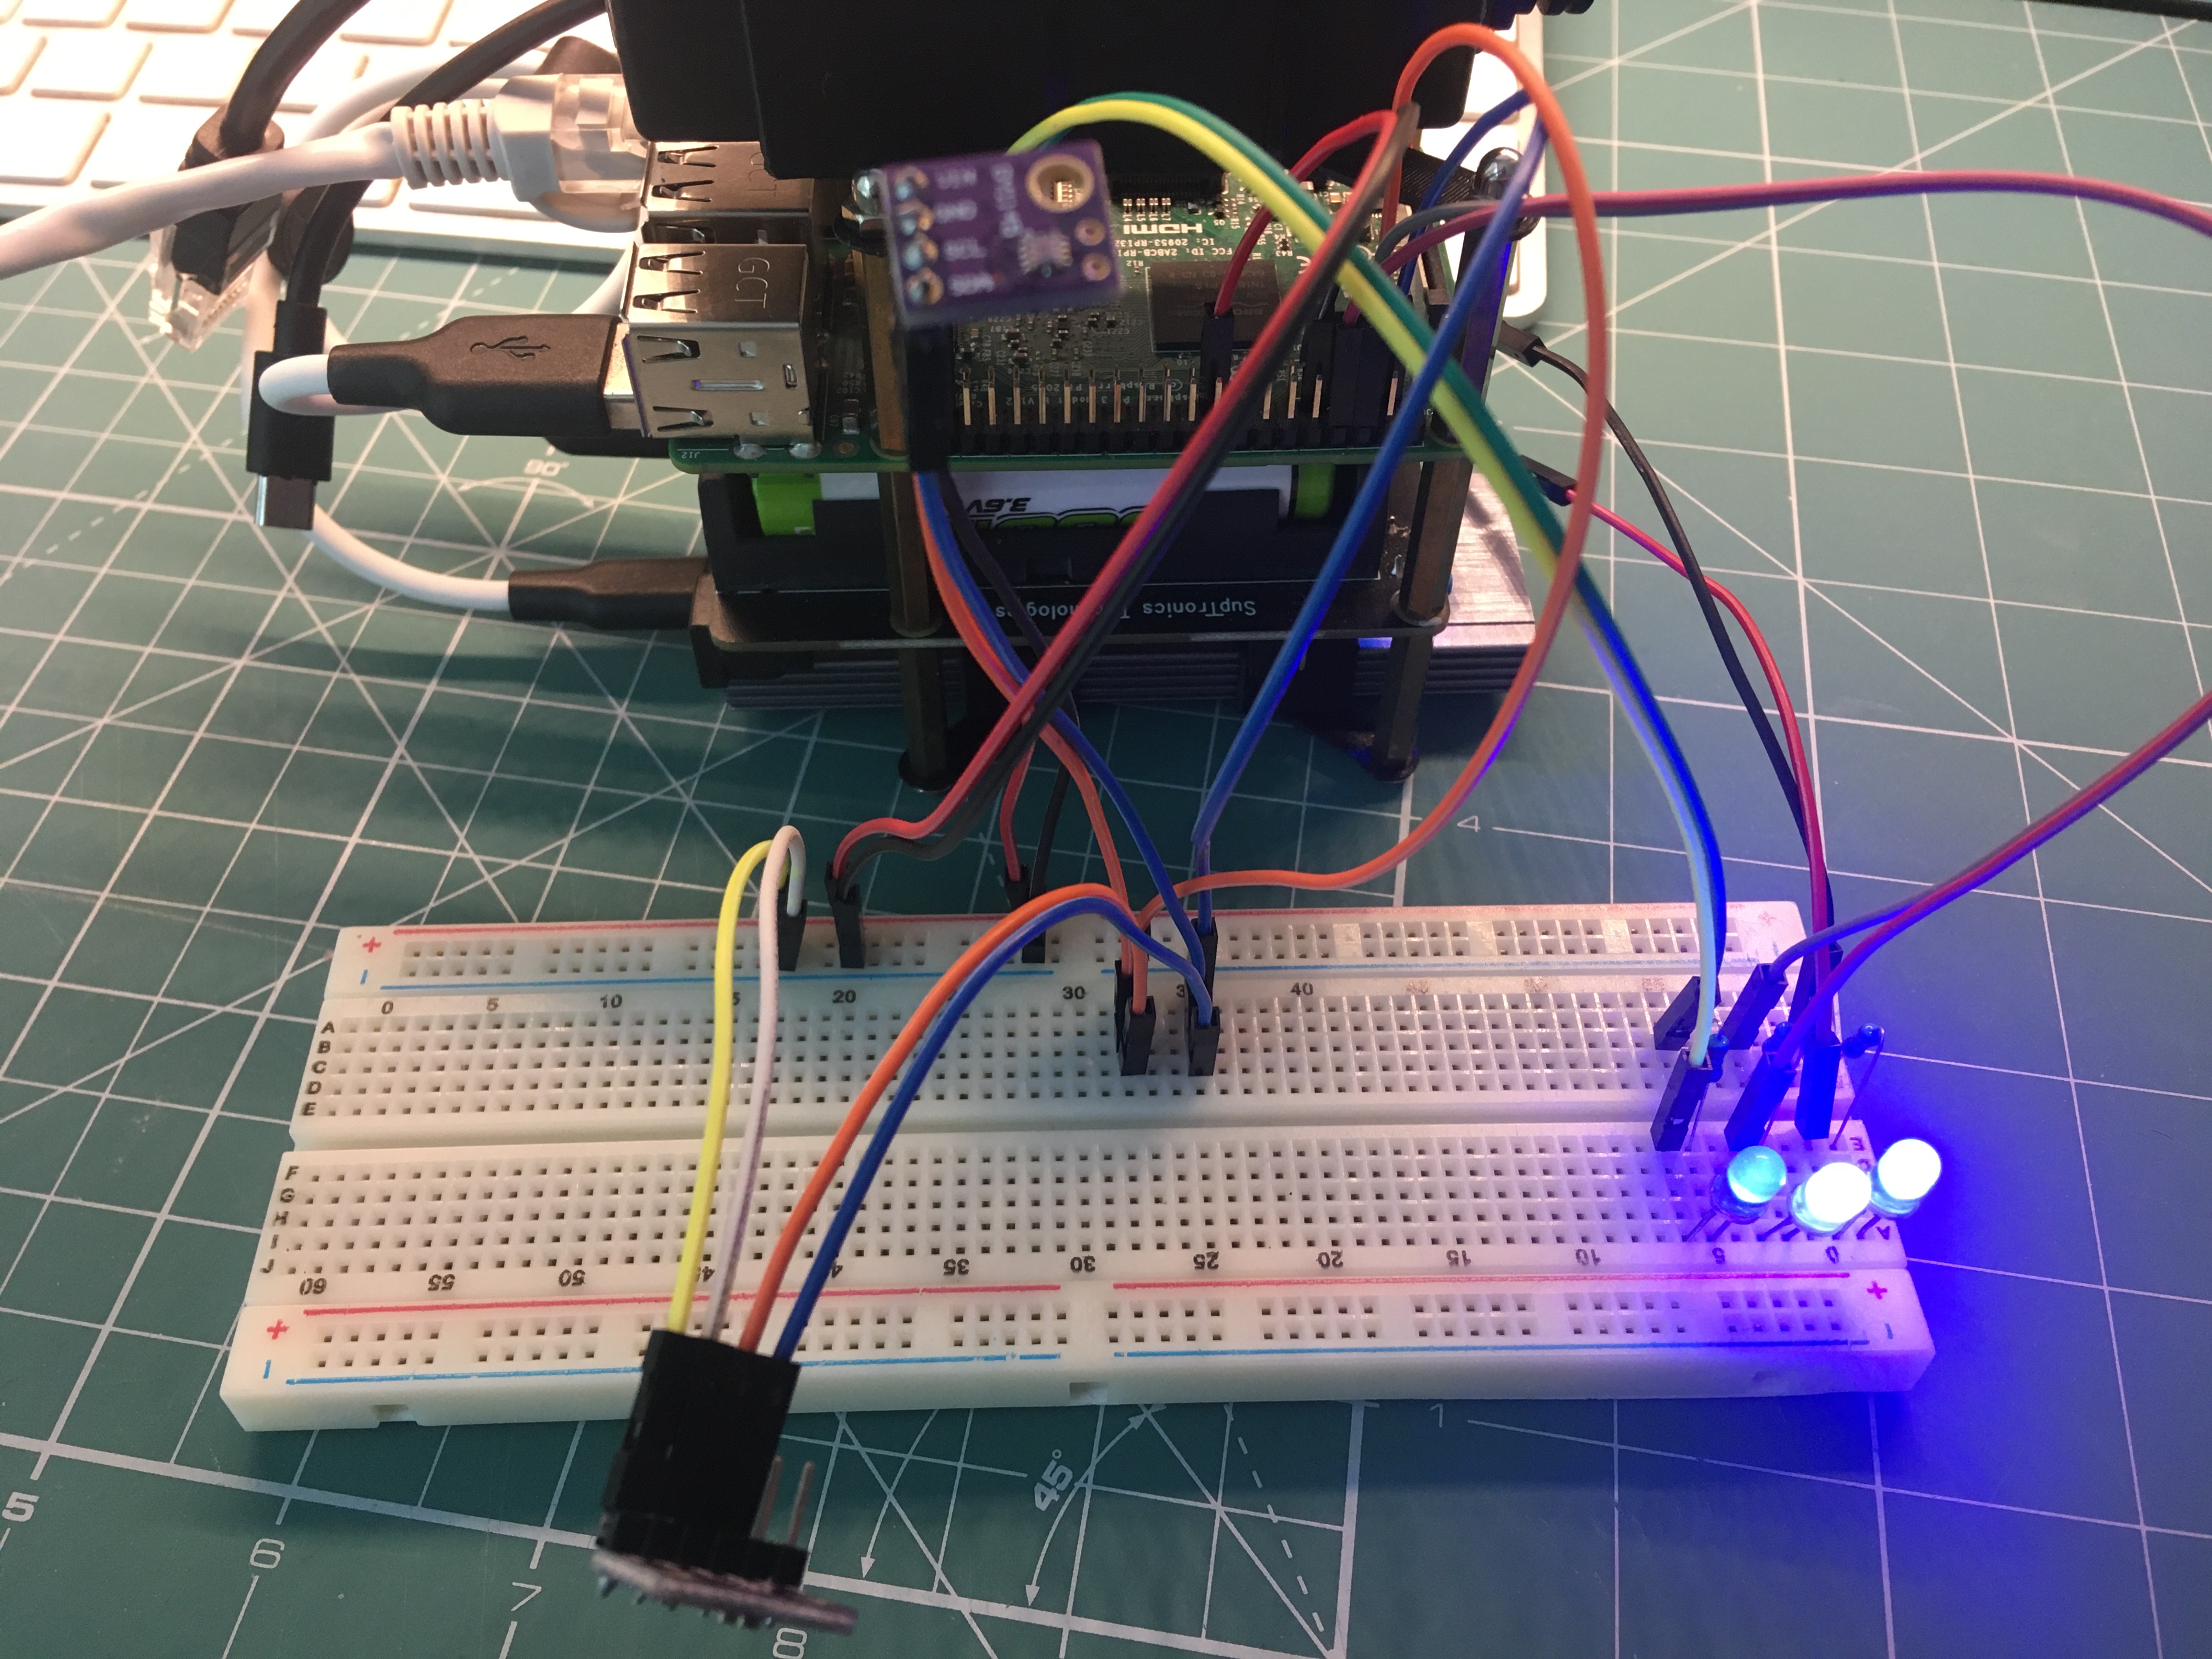
<p>Eventually this thing is going to be mounted in a cabinet on a pole in a field, so it would be helpful if the power and HDD lights were easy to see.  Fortunately Raspberry Pi supports breaking out LED’s so it was a 5 minute job to add external power and HDD activity LED’s.  I also connected a LED to one of the JST outputs on the UPS board to indicate when the board is supplying power:</p>

<p><img src="/content/2021/2021-06-03-weather-station-v2/IMG_0933.JPG" alt="" class="img-fluid" /></p>

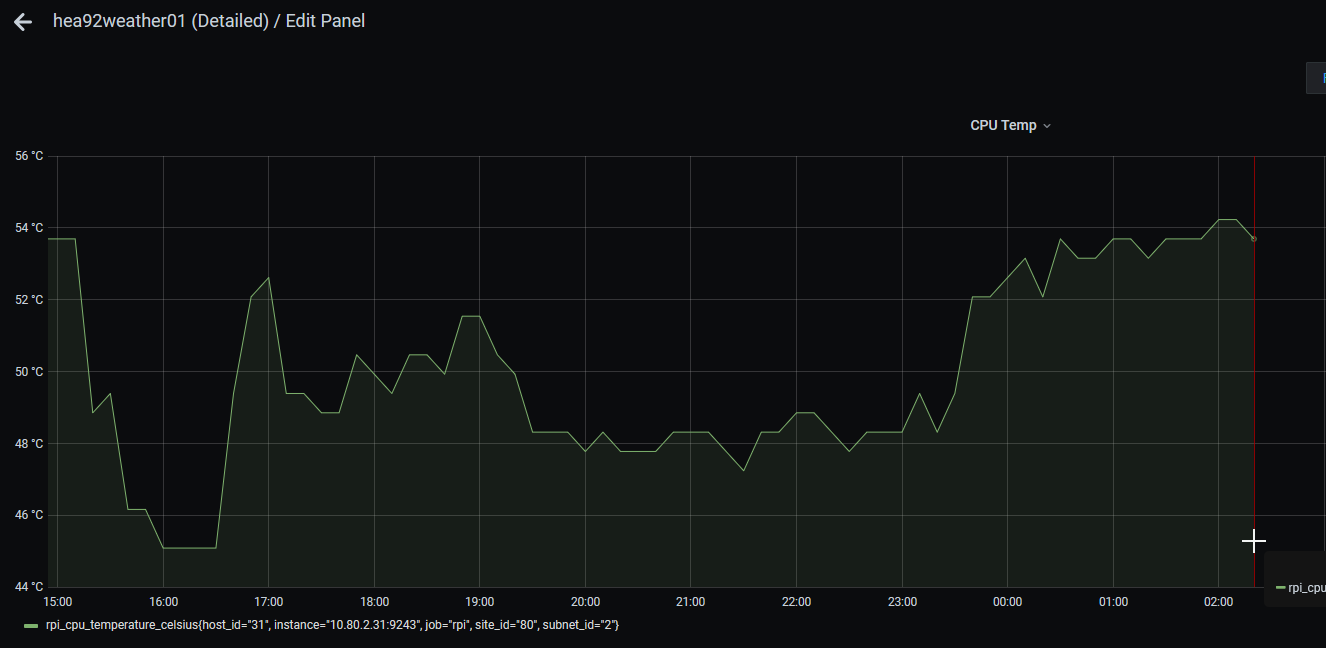
<h1 id="endurance-test">Endurance Test</h1>

<p>Even though the current UPS board is no good, I ran an endurance test to see how long these two 18650 cells could run the host for and the result was just under 16 hours.</p>

<p><img src="/content/2021/2021-06-03-weather-station-v2/endurance_test_1.png" alt="" class="img-fluid" /></p>

<p>Once I get the replacement UPS board I will re-run the endurance test, but this is already a very good indicative result - being able to survive a power outage of more than half-a-day will make this a very robust system.</p>

<h1 id="sensors">Sensors</h1>

<p>I added one new sensor in this iteration.  Originally I was going to add the I2C lightning sensor which was already in my parts bin but during the week last week the GY/SI1145 light sensor came in so I hooked that up instead.</p>

<p>I broke out the I2C bus to a breadboard and reconnected the BME280 plus added the SI1145 - blue is data and orange is clock:</p>

<p><img src="/content/2021/2021-06-03-weather-station-v2/IMG_0925.JPG" alt="" class="img-fluid" /></p>

<p>Verified connectivity and found the SI1145 at 0x60 while the BME280 is still at 0x76:</p>

<div class="language-bash highlighter-rouge"><div class="highlight"><pre class="highlight"><code>pi@hea92weather01:~ <span class="nv">$ </span>i2cdetect <span class="nt">-y</span> 1
     0  1  2  3  4  5  6  7  8  9  a  b  c  d  e  f
00:          <span class="nt">--</span> <span class="nt">--</span> <span class="nt">--</span> <span class="nt">--</span> <span class="nt">--</span> <span class="nt">--</span> <span class="nt">--</span> <span class="nt">--</span> <span class="nt">--</span> <span class="nt">--</span> <span class="nt">--</span> <span class="nt">--</span> <span class="nt">--</span>
10: <span class="nt">--</span> <span class="nt">--</span> <span class="nt">--</span> <span class="nt">--</span> <span class="nt">--</span> <span class="nt">--</span> <span class="nt">--</span> <span class="nt">--</span> <span class="nt">--</span> <span class="nt">--</span> <span class="nt">--</span> <span class="nt">--</span> <span class="nt">--</span> <span class="nt">--</span> <span class="nt">--</span> <span class="nt">--</span>
20: <span class="nt">--</span> <span class="nt">--</span> <span class="nt">--</span> <span class="nt">--</span> <span class="nt">--</span> <span class="nt">--</span> <span class="nt">--</span> <span class="nt">--</span> <span class="nt">--</span> <span class="nt">--</span> <span class="nt">--</span> <span class="nt">--</span> <span class="nt">--</span> <span class="nt">--</span> <span class="nt">--</span> <span class="nt">--</span>
30: <span class="nt">--</span> <span class="nt">--</span> <span class="nt">--</span> <span class="nt">--</span> <span class="nt">--</span> <span class="nt">--</span> <span class="nt">--</span> <span class="nt">--</span> <span class="nt">--</span> <span class="nt">--</span> <span class="nt">--</span> <span class="nt">--</span> <span class="nt">--</span> <span class="nt">--</span> <span class="nt">--</span> <span class="nt">--</span>
40: <span class="nt">--</span> <span class="nt">--</span> <span class="nt">--</span> <span class="nt">--</span> <span class="nt">--</span> <span class="nt">--</span> <span class="nt">--</span> <span class="nt">--</span> <span class="nt">--</span> <span class="nt">--</span> <span class="nt">--</span> <span class="nt">--</span> <span class="nt">--</span> <span class="nt">--</span> <span class="nt">--</span> <span class="nt">--</span>
50: <span class="nt">--</span> <span class="nt">--</span> <span class="nt">--</span> <span class="nt">--</span> <span class="nt">--</span> <span class="nt">--</span> <span class="nt">--</span> <span class="nt">--</span> <span class="nt">--</span> <span class="nt">--</span> <span class="nt">--</span> <span class="nt">--</span> <span class="nt">--</span> <span class="nt">--</span> <span class="nt">--</span> <span class="nt">--</span>
60: 60 <span class="nt">--</span> <span class="nt">--</span> <span class="nt">--</span> <span class="nt">--</span> <span class="nt">--</span> <span class="nt">--</span> <span class="nt">--</span> <span class="nt">--</span> <span class="nt">--</span> <span class="nt">--</span> <span class="nt">--</span> <span class="nt">--</span> <span class="nt">--</span> <span class="nt">--</span> <span class="nt">--</span>
70: <span class="nt">--</span> <span class="nt">--</span> <span class="nt">--</span> <span class="nt">--</span> <span class="nt">--</span> <span class="nt">--</span> 76 <span class="nt">--</span>
</code></pre></div></div>

<p>Then added the code to read the SI1145 and include it in the Influx line protocol message published to MQTT:</p>

<div class="language-python highlighter-rouge"><div class="highlight"><pre class="highlight"><code><span class="kn">import</span> <span class="n">SI1145.SI1145</span> <span class="k">as</span> <span class="n">SI1145</span>

<span class="bp">...</span>

<span class="c1">#
# GY1145 / SI1145
#
</span>
<span class="n">si1145</span> <span class="o">=</span> <span class="n">SI1145</span><span class="p">.</span><span class="nc">SI1145</span><span class="p">()</span>

<span class="bp">...</span>

<span class="c1"># SI1145
</span><span class="n">lightVisible</span> <span class="o">=</span> <span class="n">si1145</span><span class="p">.</span><span class="nf">readVisible</span><span class="p">()</span>
<span class="n">lightUV</span> <span class="o">=</span> <span class="n">si1145</span><span class="p">.</span><span class="nf">readUV</span><span class="p">()</span>
<span class="n">lightIR</span> <span class="o">=</span> <span class="n">si1145</span><span class="p">.</span><span class="nf">readIR</span><span class="p">()</span>

<span class="c1"># Publish
</span><span class="n">influx</span> <span class="o">=</span> <span class="sh">"</span><span class="s">weather,station=</span><span class="sh">"</span> <span class="o">+</span> <span class="n">weather_station_id</span> <span class="o">+</span> <span class="sh">"</span><span class="s"> </span><span class="sh">"</span> <span class="o">+</span> \
	<span class="sh">"</span><span class="s">humidity=</span><span class="sh">"</span> <span class="o">+</span> <span class="nf">str</span><span class="p">(</span><span class="n">humidity</span><span class="p">)</span> <span class="o">+</span> \
	<span class="sh">"</span><span class="s">,pressure=</span><span class="sh">"</span> <span class="o">+</span> <span class="nf">str</span><span class="p">(</span><span class="n">pressure</span><span class="p">)</span> <span class="o">+</span> \
	<span class="sh">"</span><span class="s">,temperature=</span><span class="sh">"</span> <span class="o">+</span> <span class="nf">str</span><span class="p">(</span><span class="n">temperature</span><span class="p">)</span> <span class="o">+</span> \
	<span class="sh">"</span><span class="s">,visible=</span><span class="sh">"</span> <span class="o">+</span> <span class="nf">str</span><span class="p">(</span><span class="n">lightVisible</span><span class="p">)</span> <span class="o">+</span> \
	<span class="sh">"</span><span class="s">,uv=</span><span class="sh">"</span> <span class="o">+</span> <span class="nf">str</span><span class="p">(</span><span class="n">lightUV</span><span class="p">)</span> <span class="o">+</span> \
	<span class="sh">"</span><span class="s">,ir=</span><span class="sh">"</span> <span class="o">+</span> <span class="nf">str</span><span class="p">(</span><span class="n">lightIR</span><span class="p">)</span>
</code></pre></div></div>

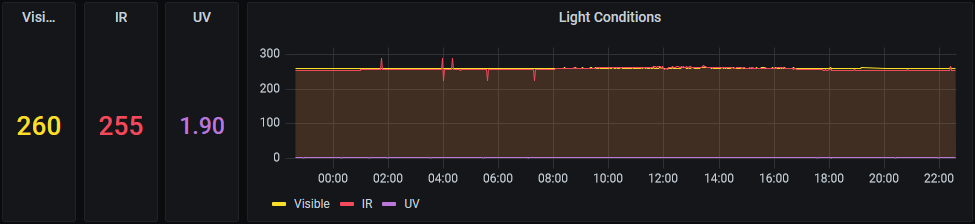
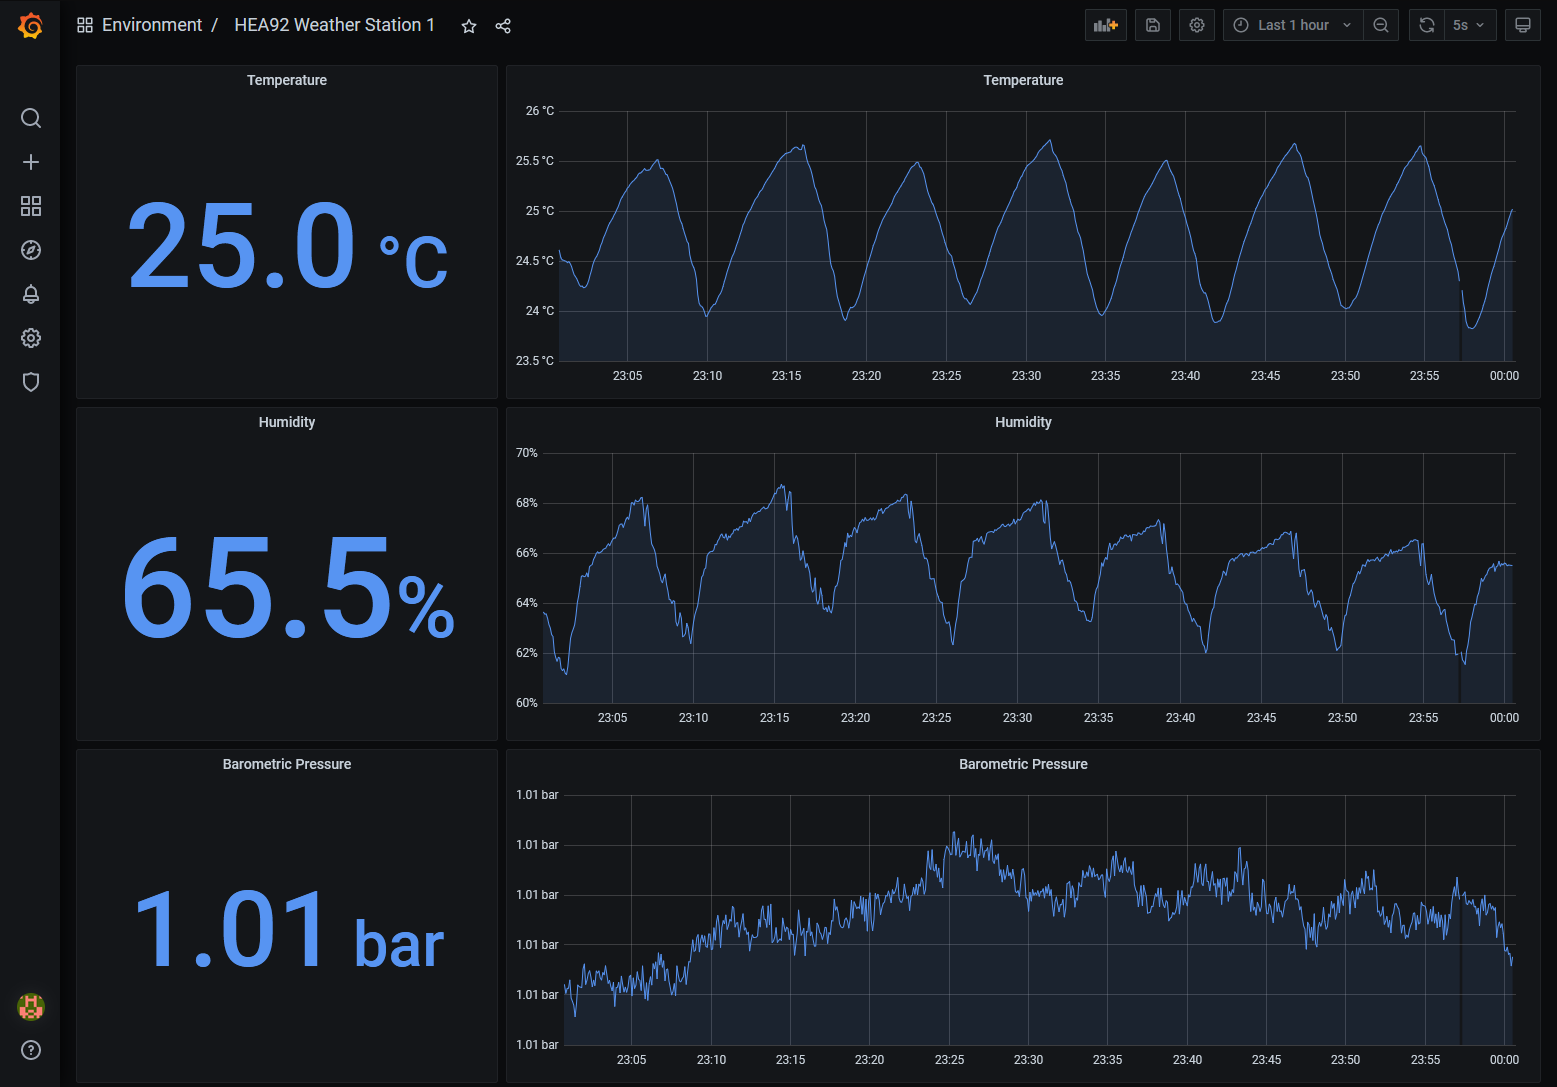
<p>And added some panels to my weather station dashboard in my main Grafana instances:</p>

<p><img src="/content/2021/2021-06-03-weather-station-v2/grafana_light_panels.png" alt="" class="img-fluid" /></p>

<h1 id="data-plane">Data Plane</h1>

<h2 id="overview-1">Overview</h2>

<p>Most of my time on this iteration was spent on the data plane.  The improvements here were:</p>

<ul>
  <li>Handle SIGTERM</li>
  <li>MQTT Auto-Reconnect</li>
  <li>Containerized the sensor-reader Python script</li>
  <li>Added a custom bridge network to connect the three Docker Compose stacks</li>
  <li>Added an on-prem MQTT broker and InfluxDB storage</li>
  <li>Configured the edge MQTT broker to bridge to the on-prem MQTT broker</li>
  <li>Connect Grafana to use the on-prem InfluxDB instead of edge InfluxDB</li>
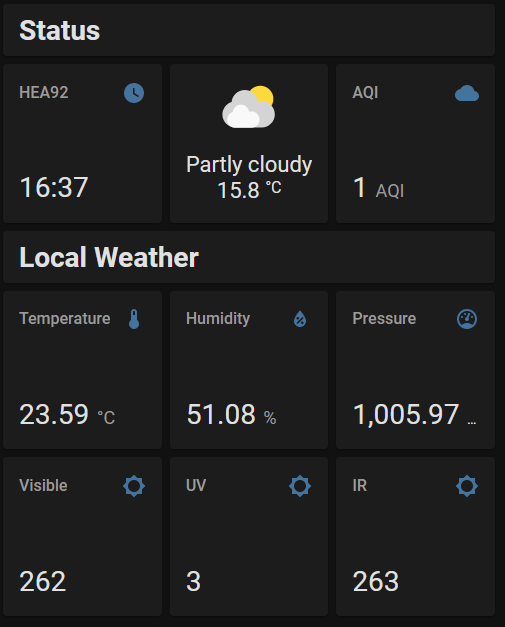
  <li>Connected my Home Assistant instance to MQTT and added visualizations</li>
  <li>De-hardcode sensor-reader</li>
</ul>

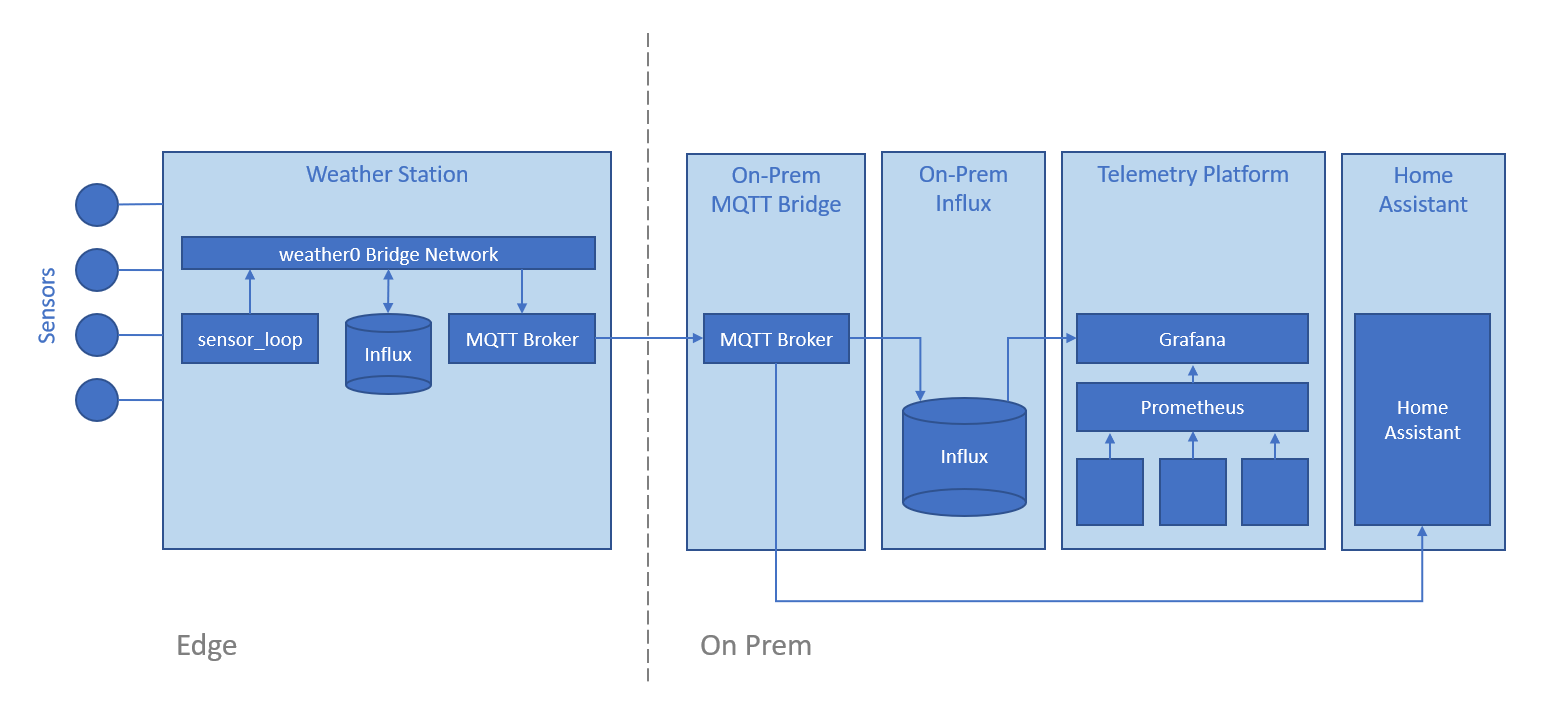
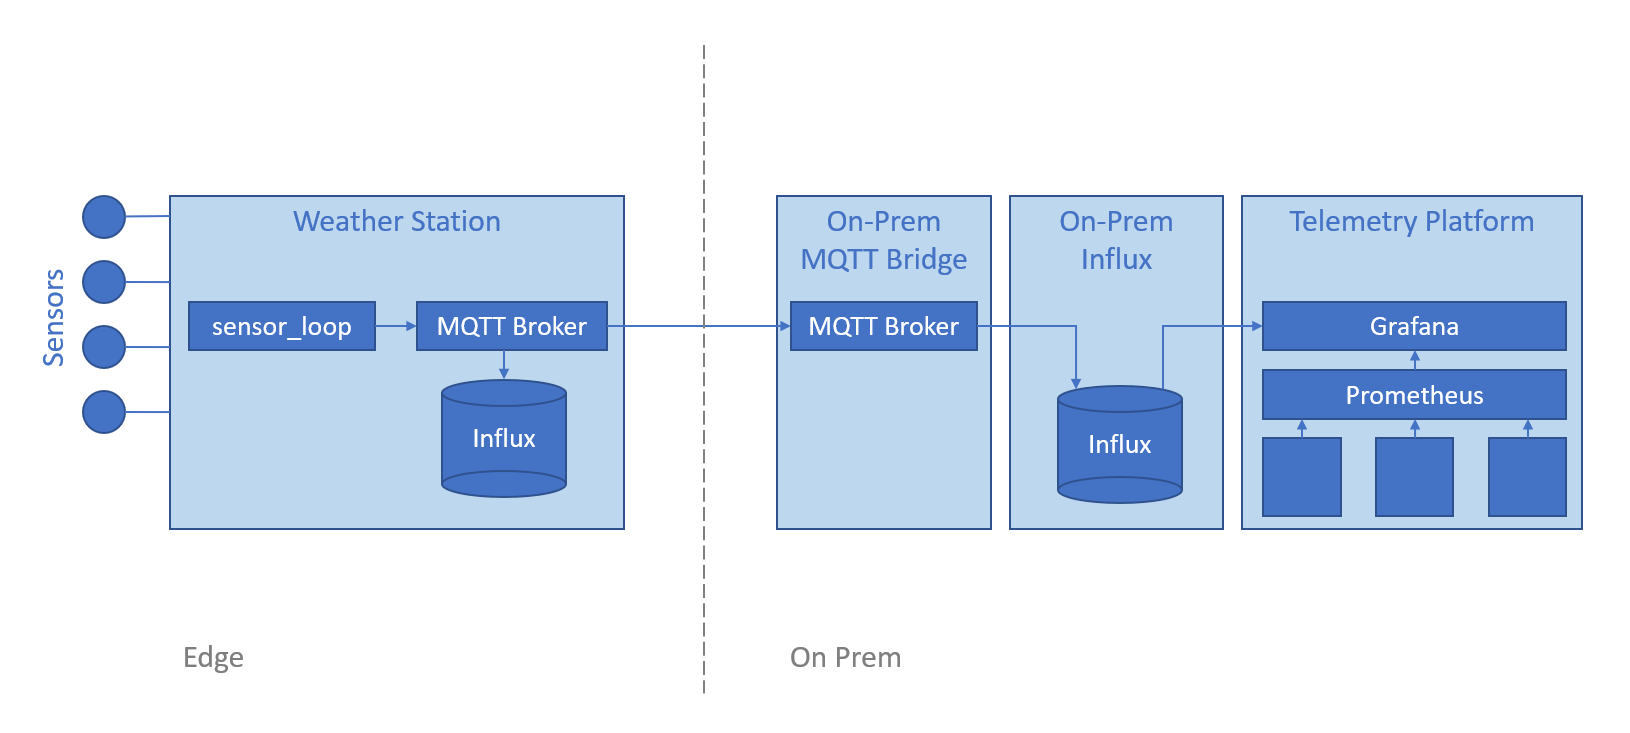
<p>The data plane now looks like this:</p>

<p><img src="/content/2021/2021-06-03-weather-station-v2/architecture.png" alt="" class="img-fluid" /></p>

<h2 id="handle-sigterm">Handle SIGTERM</h2>

<p>In order to be a good container citizen I added support for SIGTERM and SIGINT Linux signals - this is the skeleton for signal handling:</p>

<div class="language-python highlighter-rouge"><div class="highlight"><pre class="highlight"><code>
<span class="k">class</span> <span class="nc">SensorReader</span><span class="p">:</span>

	<span class="k">def</span> <span class="nf">__init__</span><span class="p">(</span><span class="n">self</span><span class="p">):</span>
		<span class="n">self</span><span class="p">.</span><span class="n">stopped</span> <span class="o">=</span> <span class="bp">False</span>
        
	<span class="k">def</span> <span class="nf">run</span><span class="p">():</span>
		<span class="k">while</span> <span class="ow">not</span> <span class="n">self</span><span class="p">.</span><span class="n">stopped</span><span class="p">:</span>
            <span class="c1"># Process sensors
</span>            <span class="nf">sleep</span><span class="p">(</span><span class="mi">1</span><span class="p">)</span>

	<span class="k">def</span> <span class="nf">stop</span><span class="p">(</span><span class="n">self</span><span class="p">,</span> <span class="n">signal</span><span class="p">,</span> <span class="n">frame</span><span class="p">):</span>
		<span class="nf">print</span><span class="p">(</span><span class="sh">"</span><span class="s">Stopping SensorReader</span><span class="sh">"</span><span class="p">)</span>
		<span class="n">self</span><span class="p">.</span><span class="n">stopped</span> <span class="o">=</span> <span class="bp">True</span>
        
<span class="k">def</span> <span class="nf">main</span><span class="p">():</span>
	<span class="n">sensorReader</span> <span class="o">=</span> <span class="nc">SensorReader</span><span class="p">()</span>
	<span class="n">signal</span><span class="p">.</span><span class="nf">signal</span><span class="p">(</span><span class="n">signal</span><span class="p">.</span><span class="n">SIGINT</span><span class="p">,</span> <span class="n">sensorReader</span><span class="p">.</span><span class="n">stop</span><span class="p">)</span>
	<span class="n">signal</span><span class="p">.</span><span class="nf">signal</span><span class="p">(</span><span class="n">signal</span><span class="p">.</span><span class="n">SIGTERM</span><span class="p">,</span> <span class="n">sensorReader</span><span class="p">.</span><span class="n">stop</span><span class="p">)</span>
	<span class="n">sensorReader</span><span class="p">.</span><span class="nf">run</span><span class="p">()</span>

<span class="k">if</span> <span class="n">__name__</span> <span class="o">==</span> <span class="sh">"</span><span class="s">__main__</span><span class="sh">"</span><span class="p">:</span>
	<span class="nf">main</span><span class="p">()</span>
</code></pre></div></div>

<p>This was adapted from a post but I’ve misplaced the reference.</p>

<h2 id="mqtt-auto-reconnect">MQTT Auto-Reconnect</h2>

<p>My original MQTT implementation was bare bones.  I’ve added code based on some helpful articles from <a href="http://www.steves-internet-guide.com/">Steves Internet Guide</a> to track connection state and leverage <a href="https://pypi.org/project/paho-mqtt/">Paho MQTT’s</a> built-in auto-reconnect functionality:</p>

<div class="language-python highlighter-rouge"><div class="highlight"><pre class="highlight"><code>		<span class="c1">#
</span>		<span class="c1"># Configure MQTT CLient
</span>		<span class="c1">#
</span>
		<span class="k">def</span> <span class="nf">mqtt_on_connect</span><span class="p">(</span><span class="n">client</span><span class="p">,</span> <span class="n">userdata</span><span class="p">,</span> <span class="n">flags</span><span class="p">,</span> <span class="n">rc</span><span class="p">):</span>
			<span class="k">if</span> <span class="n">rc</span> <span class="o">==</span> <span class="mi">0</span><span class="p">:</span>
				<span class="nf">print</span><span class="p">(</span><span class="sh">"</span><span class="s">Connected to MQTT broker</span><span class="sh">"</span><span class="p">)</span>
				<span class="n">client</span><span class="p">.</span><span class="n">connected_flag</span> <span class="o">=</span> <span class="bp">True</span>
			<span class="k">else</span><span class="p">:</span>
				<span class="nf">print</span><span class="p">(</span><span class="sh">"</span><span class="s">Failed to connect</span><span class="sh">"</span><span class="p">)</span>

		<span class="k">def</span> <span class="nf">mqtt_on_disconnect</span><span class="p">(</span><span class="n">client</span><span class="p">,</span> <span class="n">userdata</span><span class="p">,</span> <span class="n">rc</span><span class="p">):</span>
			<span class="nf">print</span><span class="p">(</span><span class="sh">"</span><span class="s">Disconnecting reason </span><span class="sh">"</span> <span class="o">+</span> <span class="nf">str</span><span class="p">(</span><span class="n">rc</span><span class="p">))</span>
			<span class="n">client</span><span class="p">.</span><span class="n">connected_flag</span> <span class="o">=</span> <span class="bp">False</span>
			<span class="n">client</span><span class="p">.</span><span class="n">disconnect_flag</span> <span class="o">=</span> <span class="bp">True</span>

		<span class="n">client</span> <span class="o">=</span> <span class="n">mqtt</span><span class="p">.</span><span class="nc">Client</span><span class="p">(</span><span class="n">weather_station_id</span><span class="p">)</span>
		<span class="n">client</span><span class="p">.</span><span class="n">on_connect</span> <span class="o">=</span> <span class="n">mqtt_on_connect</span>
		<span class="n">client</span><span class="p">.</span><span class="n">on_disconnect</span> <span class="o">=</span> <span class="n">mqtt_on_disconnect</span>
		<span class="n">client</span><span class="p">.</span><span class="n">connected_flag</span> <span class="o">=</span> <span class="bp">False</span>
		<span class="n">client</span><span class="p">.</span><span class="nf">username_pw_set</span><span class="p">(</span><span class="n">broker_username</span><span class="p">,</span> <span class="n">broker_password</span><span class="p">)</span>
		<span class="n">client</span><span class="p">.</span><span class="nf">connect</span><span class="p">(</span><span class="n">broker_host_name</span><span class="p">,</span> <span class="n">broker_port</span><span class="p">)</span>
		<span class="n">client</span><span class="p">.</span><span class="nf">loop_start</span><span class="p">()</span>

		<span class="k">while</span> <span class="ow">not</span> <span class="n">self</span><span class="p">.</span><span class="n">stopped</span> <span class="ow">and</span> <span class="ow">not</span> <span class="n">client</span><span class="p">.</span><span class="n">connected_flag</span><span class="p">:</span>
			<span class="nf">print</span><span class="p">(</span><span class="sh">"</span><span class="s">Waiting for connection</span><span class="sh">"</span><span class="p">)</span>
			<span class="nf">sleep</span><span class="p">(</span><span class="mi">1</span><span class="p">)</span>

         <span class="k">while</span> <span class="ow">not</span> <span class="n">self</span><span class="p">.</span><span class="n">stopped</span><span class="p">:</span>

			<span class="nf">if </span><span class="p">(</span><span class="n">client</span><span class="p">.</span><span class="n">connected_flag</span><span class="p">):</span>
                
				<span class="c1"># Read sensors and publish to MQTT
</span>
				<span class="nf">sleep</span><span class="p">(</span><span class="mi">15</span><span class="p">)</span>

			<span class="k">else</span><span class="p">:</span>
				<span class="nf">print</span><span class="p">(</span><span class="sh">"</span><span class="s">Connection lost.  Waiting for reconnection</span><span class="sh">"</span><span class="p">)</span>
				<span class="nf">sleep</span><span class="p">(</span><span class="mi">5</span><span class="p">)</span>

		<span class="n">client</span><span class="p">.</span><span class="nf">loop_stop</span><span class="p">()</span>
		<span class="n">client</span><span class="p">.</span><span class="nf">disconnect</span><span class="p">()</span>
</code></pre></div></div>

<p>This now means if the local MQTT broker goes down, sensor-reader will retry until it can connect again and the sensor readings will flow once again.</p>

<h2 id="containerize-sensor-reader">Containerize sensor-reader</h2>

<p>The daemon that reads sensors and publishes the values to MQTT is called <code class="language-plaintext highlighter-rouge">sensor-reader</code> and it’s implemented as a simple Python3 script.  To Dockerize this I just had to create a requirements.txt to enumerate the packages that I had previously installed manually:</p>

<pre><code class="language-txt">RPi.bme280
paho-mqtt
SI1145
</code></pre>

<p>Then created a simple Dockerfile based on the official <a href="https://hub.docker.com/_/python">Python</a> image:</p>

<div class="language-dockerfile highlighter-rouge"><div class="highlight"><pre class="highlight"><code><span class="k">FROM</span><span class="s"> python:3.9.5-buster</span>

<span class="k">RUN </span><span class="nb">mkdir</span> /app
<span class="k">WORKDIR</span><span class="s"> /app</span>

<span class="k">COPY</span><span class="s"> main.py ./</span>
<span class="k">COPY</span><span class="s"> requirements.txt ./</span>
<span class="k">RUN </span>pip <span class="nb">install</span> <span class="nt">--no-cache-dir</span> <span class="nt">-r</span> requirements.txt

<span class="k">CMD</span><span class="s"> [ "python3", "./main.py" ]</span>
</code></pre></div></div>

<p>I initially wanted to use the alpine-based image but there is a problem running it on 32-bit RPi OS without privileged mode, so I fell back to the Debian Buster based image instead.</p>

<p>On first run I got this error:</p>

<div class="language-bash highlighter-rouge"><div class="highlight"><pre class="highlight"><code>pi@hea92weather01:~/als_sys_host_031_hea92weather01/sensor-reader <span class="nv">$ </span>./run.sh
Traceback <span class="o">(</span>most recent call last<span class="o">)</span>:
  File <span class="s2">"/app/./main.py"</span>, line 92, <span class="k">in</span> &lt;module&gt;
    main<span class="o">()</span>
...
FileNotFoundError: <span class="o">[</span>Errno 2] No such file or directory: <span class="s1">'/dev/i2c-1'</span>
</code></pre></div></div>

<p>Which was solved by mapping that device through when running the container:</p>

<div class="language-bash highlighter-rouge"><div class="highlight"><pre class="highlight"><code><span class="nb">sudo </span>docker run <span class="se">\</span>
    <span class="nt">-it</span> <span class="nt">--rm</span> <span class="se">\</span>
    <span class="nt">--device</span> /dev/i2c-1 <span class="se">\</span>
    sensor-reader:latest
</code></pre></div></div>

<p>After successfully testing the image I created a docker-compose config for easier startup:</p>

<div class="language-yaml highlighter-rouge"><div class="highlight"><pre class="highlight"><code><span class="na">version</span><span class="pi">:</span> <span class="s2">"</span><span class="s">3"</span>
<span class="na">services</span><span class="pi">:</span>

  <span class="c1">#</span>
  <span class="c1"># SensorReader</span>
  <span class="c1">#</span>

  <span class="na">sensorreader</span><span class="pi">:</span>
    <span class="na">image</span><span class="pi">:</span> <span class="s2">"</span><span class="s">aleisium/sensor-reader:latest"</span>
    <span class="na">restart</span><span class="pi">:</span> <span class="s2">"</span><span class="s">always"</span>
    <span class="na">devices</span><span class="pi">:</span>
      <span class="pi">-</span> <span class="s2">"</span><span class="s">/dev/i2c-1:/dev/i2c-1"</span>
</code></pre></div></div>

<h2 id="custom-bridge-network">Custom Bridge Network</h2>

<p>I intentionally have three separate docker-compose stacks - the reason for this is that I want to be able to easily start and stop the MQTT broker, the local InfluxDB storage and the sensor-reader independently.  This could also be achieved by having a single stack with convenience scripts to selectively stop and remove containers, and I may yet do that, but for now it’s nicer having separate stacks.</p>

<p>The problem with separate stacks is if you make them communicate via the physical <code class="language-plaintext highlighter-rouge">eth0</code> interface, connectivity is lost when the network cable is pulled.</p>

<p>To solve this I created a custom bridge network in Docker and connected the three stacks to it.</p>

<p>The bridge is created with the script <code class="language-plaintext highlighter-rouge">network/up.sh</code>:</p>

<div class="language-bash highlighter-rouge"><div class="highlight"><pre class="highlight"><code><span class="c">#!/bin/bash</span>

<span class="nb">sudo </span>docker network create <span class="nt">--driver</span><span class="o">=</span>bridge <span class="nt">--subnet</span><span class="o">=</span>10.12.1.0/16 weather0
</code></pre></div></div>

<p>Then each of the three stacks are connected to that network - for example, <code class="language-plaintext highlighter-rouge">sensor-reader</code>:</p>

<div class="language-yaml highlighter-rouge"><div class="highlight"><pre class="highlight"><code><span class="na">version</span><span class="pi">:</span> <span class="s2">"</span><span class="s">3"</span>
<span class="na">services</span><span class="pi">:</span>

  <span class="c1">#</span>
  <span class="c1"># SensorReader</span>
  <span class="c1">#</span>

  <span class="na">sensorreader</span><span class="pi">:</span>
    <span class="na">image</span><span class="pi">:</span> <span class="s2">"</span><span class="s">aleisium/sensor-reader:latest"</span>
    <span class="na">networks</span><span class="pi">:</span>
      <span class="pi">-</span> <span class="s2">"</span><span class="s">weather0"</span>
    <span class="na">restart</span><span class="pi">:</span> <span class="s2">"</span><span class="s">always"</span>
    <span class="na">devices</span><span class="pi">:</span>
      <span class="pi">-</span> <span class="s2">"</span><span class="s">/dev/i2c-1:/dev/i2c-1"</span>

<span class="na">networks</span><span class="pi">:</span>
  <span class="na">weather0</span><span class="pi">:</span>
    <span class="na">external</span><span class="pi">:</span> <span class="kc">true</span>
    <span class="na">name</span><span class="pi">:</span> <span class="s2">"</span><span class="s">weather0"</span>
</code></pre></div></div>

<h2 id="on-prem-mqtt-broker">On-Prem MQTT Broker</h2>

<p>I established a new “central” MQTT broker on a VM under ProxMox.  I also now have an InfluxDB 1.8 instance with a Telegraf agent that reads from that central MQTT and stores measurements on-prem.</p>

<p>The central MQTT, Influx and Telegraf configs are separate from my weather station GitHub but I’ll be adding a similar config soon to make it easier for others to re-use.</p>

<h2 id="edge-mqtt-bridge-to-on-prem-mqtt">Edge MQTT Bridge to On-Prem MQTT</h2>

<p>I’m using the venerable Mosquitto MQTT broker which supports bridging - meaning an instance of the broker can be instructed to act as a client to another broker to read and / or write messages.</p>

<p>I added the following bridge config to <code class="language-plaintext highlighter-rouge">broker/config/mosquitto.conf</code> for the MQTT broker on the weather station:</p>

<div class="language-plaintext highlighter-rouge"><div class="highlight"><pre class="highlight"><code>connection central
address 10.80.2.60:1883
remote_username hea92weather01
remote_password password
topic # out
</code></pre></div></div>

<p>This causes the weather station to forward all messages it receives to the broker at 10.80.2.60 using the specified credentials.  In this syntax # is not a comment marker but a wildcard indicating “all” messages.</p>

<p>References:</p>

<ul>
  <li><a href="https://mosquitto.org/man/mosquitto-conf-5.html">mosquitto_conf Documentation</a></li>
</ul>

<h2 id="point-grafana-to-on-prem-influxdb">Point Grafana to On-Prem InfluxDB</h2>

<p>As I use <a href="https://grafana.com/docs/grafana/latest/administration/provisioning/">Grafana Provisioning</a> for infrastructure-as-code of my telemetry stack, I just had to commit the address change to the data source definition in Git:</p>

<div class="language-yaml highlighter-rouge"><div class="highlight"><pre class="highlight"><code><span class="na">apiVersion</span><span class="pi">:</span> <span class="m">1</span>

<span class="c1"># list of datasources that should be deleted from the database</span>
<span class="na">deleteDatasources</span><span class="pi">:</span>
  <span class="pi">-</span> <span class="na">name</span><span class="pi">:</span> <span class="s2">"</span><span class="s">hea92weather01"</span>
    <span class="na">orgId</span><span class="pi">:</span> <span class="m">1</span>

<span class="c1"># list of datasources to insert/update depending</span>
<span class="c1"># what's available in the database</span>
<span class="na">datasources</span><span class="pi">:</span>
  <span class="pi">-</span> <span class="na">name</span><span class="pi">:</span> <span class="s2">"</span><span class="s">hea92weather01"</span>
    <span class="na">type</span><span class="pi">:</span> <span class="s2">"</span><span class="s">influxdb"</span>
    <span class="na">access</span><span class="pi">:</span> <span class="s2">"</span><span class="s">proxy"</span>
    <span class="na">database</span><span class="pi">:</span> <span class="s2">"</span><span class="s">weather"</span>
    <span class="na">user</span><span class="pi">:</span> <span class="s2">"</span><span class="s">grafana"</span>
    <span class="na">password</span><span class="pi">:</span> <span class="s2">"</span><span class="s">password"</span>
    <span class="na">url</span><span class="pi">:</span> <span class="s2">"</span><span class="s">http://10.80.2.60:8086"</span>
</code></pre></div></div>

<p>Then re-launch the telemetry stack.</p>

<h2 id="home-assistant-integration">Home Assistant Integration</h2>

<p>Defined a connection to the central MQTT broker in Home Assistant’s configuration.yaml:</p>

<div class="language-yaml highlighter-rouge"><div class="highlight"><pre class="highlight"><code><span class="na">mqtt</span><span class="pi">:</span>
  <span class="na">broker</span><span class="pi">:</span> <span class="s2">"</span><span class="s">10.80.2.60"</span>
  <span class="na">port</span><span class="pi">:</span> <span class="m">1883</span>
  <span class="na">client_id</span><span class="pi">:</span> <span class="s2">"</span><span class="s">bkk80ha"</span>
  <span class="na">username</span><span class="pi">:</span> <span class="s2">"</span><span class="s">bkk80ha"</span>
  <span class="na">password</span><span class="pi">:</span> <span class="s2">"</span><span class="s">password"</span>
</code></pre></div></div>

<p>Added sensors to subscribe to values of interest from MQTT:</p>

<div class="language-yaml highlighter-rouge"><div class="highlight"><pre class="highlight"><code>  <span class="pi">-</span> <span class="na">platform</span><span class="pi">:</span> <span class="s2">"</span><span class="s">mqtt"</span>
    <span class="na">name</span><span class="pi">:</span> <span class="s2">"</span><span class="s">HEA92</span><span class="nv"> </span><span class="s">Temperature"</span>
    <span class="na">state_topic</span><span class="pi">:</span> <span class="s2">"</span><span class="s">weather/hea92weather01/temperature"</span>
    <span class="na">device_class</span><span class="pi">:</span> <span class="s2">"</span><span class="s">temperature"</span>
    <span class="na">unit_of_measurement</span><span class="pi">:</span> <span class="s2">"</span><span class="s">°C"</span>
    <span class="na">value_template</span><span class="pi">:</span> <span class="s2">"</span><span class="s">0"</span>
  <span class="pi">-</span> <span class="na">platform</span><span class="pi">:</span> <span class="s2">"</span><span class="s">mqtt"</span>
    <span class="na">name</span><span class="pi">:</span> <span class="s2">"</span><span class="s">HEA92</span><span class="nv"> </span><span class="s">Humidity"</span>
    <span class="na">state_topic</span><span class="pi">:</span> <span class="s2">"</span><span class="s">weather/hea92weather01/humidity"</span>
    <span class="na">device_class</span><span class="pi">:</span> <span class="s2">"</span><span class="s">humidity"</span>
    <span class="na">unit_of_measurement</span><span class="pi">:</span> <span class="s2">"</span><span class="s">%"</span>
    <span class="na">value_template</span><span class="pi">:</span> <span class="s2">"</span><span class="s">0"</span>
  <span class="pi">-</span> <span class="na">platform</span><span class="pi">:</span> <span class="s2">"</span><span class="s">mqtt"</span>
    <span class="na">name</span><span class="pi">:</span> <span class="s2">"</span><span class="s">HEA92</span><span class="nv"> </span><span class="s">Pressure"</span>
    <span class="na">state_topic</span><span class="pi">:</span> <span class="s2">"</span><span class="s">weather/hea92weather01/pressure"</span>
    <span class="na">device_class</span><span class="pi">:</span> <span class="s2">"</span><span class="s">pressure"</span>
    <span class="na">unit_of_measurement</span><span class="pi">:</span> <span class="s2">"</span><span class="s">mbar"</span>
    <span class="na">value_template</span><span class="pi">:</span> <span class="s2">"</span><span class="s">0"</span>
  <span class="pi">-</span> <span class="na">platform</span><span class="pi">:</span> <span class="s2">"</span><span class="s">mqtt"</span>
    <span class="na">name</span><span class="pi">:</span> <span class="s2">"</span><span class="s">HEA92</span><span class="nv"> </span><span class="s">Visible</span><span class="nv"> </span><span class="s">Light"</span>
    <span class="na">state_topic</span><span class="pi">:</span> <span class="s2">"</span><span class="s">weather/hea92weather01/visible"</span>
    <span class="na">device_class</span><span class="pi">:</span> <span class="s2">"</span><span class="s">illuminance"</span>
  <span class="pi">-</span> <span class="na">platform</span><span class="pi">:</span> <span class="s2">"</span><span class="s">mqtt"</span>
    <span class="na">name</span><span class="pi">:</span> <span class="s2">"</span><span class="s">HEA92</span><span class="nv"> </span><span class="s">UV"</span>
    <span class="na">state_topic</span><span class="pi">:</span> <span class="s2">"</span><span class="s">weather/hea92weather01/uv"</span>
    <span class="na">device_class</span><span class="pi">:</span> <span class="s2">"</span><span class="s">illuminance"</span>
  <span class="pi">-</span> <span class="na">platform</span><span class="pi">:</span> <span class="s2">"</span><span class="s">mqtt"</span>
    <span class="na">name</span><span class="pi">:</span> <span class="s2">"</span><span class="s">HEA92</span><span class="nv"> </span><span class="s">IR"</span>
    <span class="na">state_topic</span><span class="pi">:</span> <span class="s2">"</span><span class="s">weather/hea92weather01/ir"</span>
    <span class="na">device_class</span><span class="pi">:</span> <span class="s2">"</span><span class="s">illuminance"</span>

</code></pre></div></div>

<p>Finally added some cards to a dashboard in Home Assistant:</p>

<p><img src="/content/2021/2021-06-03-weather-station-v2/ha.png" alt="" class="img-fluid" /></p>

<p>Further elaboration is available in the <a href="https://github.com/brendonmatheson/weather-station">README.md</a>.</p>

<p>References:</p>

<ul>
  <li><a href="https://www.home-assistant.io/docs/mqtt/broker/">Home Assistant MQTT Broker</a></li>
  <li><a href="https://www.home-assistant.io/integrations/sensor.mqtt/">Home Assistant MQTT Sensor</a></li>
</ul>

<h2 id="de-hardcode-sensor-reader">De-hardcode sensor-reader</h2>

<p>Finally as a move towards making my weather station stack easily re-usable by others, I started parameterizing some of the hardcoded values in sensor-reader and moving them to environment variables so that they can be passed through the docker-compose file:</p>

<div class="language-yaml highlighter-rouge"><div class="highlight"><pre class="highlight"><code>  <span class="na">sensorreader</span><span class="pi">:</span>
    <span class="na">environment</span><span class="pi">:</span>
      <span class="pi">-</span> <span class="s2">"</span><span class="s">WEATHER_STATION_ID=hea92weather01"</span>
      <span class="pi">-</span> <span class="s2">"</span><span class="s">BROKER_USERNAME=hea92weather01"</span>
      <span class="pi">-</span> <span class="s2">"</span><span class="s">BROKER_PASSWORD=password"</span>
      <span class="pi">-</span> <span class="s2">"</span><span class="s">SAMPLE_INTERVAL=15"</span>
    <span class="na">image</span><span class="pi">:</span> <span class="s2">"</span><span class="s">aleisium/sensor-reader:latest"</span>
    <span class="na">networks</span><span class="pi">:</span>
      <span class="pi">-</span> <span class="s2">"</span><span class="s">weather0"</span>
    <span class="na">restart</span><span class="pi">:</span> <span class="s2">"</span><span class="s">always"</span>
    <span class="na">devices</span><span class="pi">:</span>
      <span class="pi">-</span> <span class="s2">"</span><span class="s">/dev/i2c-1:/dev/i2c-1"</span>
</code></pre></div></div>

<h1 id="next-steps">Next Steps</h1>

<p>The next improvements are:</p>

<ul>
  <li>Processing of light readings into meaningful values</li>
  <li>Improve documentation and scripts to make it easier for others to re-use my configuration</li>
  <li>More sensors</li>
  <li>Test the new UPS board when it arrives</li>
  <li>Enclosure for the electronics</li>
  <li>Trial field deployment (on our condo balcony)</li>
</ul>]]></content><author><name></name></author><category term="observability" /><category term="farming" /><category term="iot" /><category term="weather_station" /><summary type="html"><![CDATA[Time to catch up on the additions and improvements on the weather station since I built the first MVP.]]></summary></entry><entry><title type="html">Irrigation Pipe Clips</title><link href="https://brendonmatheson.com/2021/05/30/irrigation-pipe-clips.html" rel="alternate" type="text/html" title="Irrigation Pipe Clips" /><published>2021-05-30T14:20:00+00:00</published><updated>2021-05-30T14:20:00+00:00</updated><id>https://brendonmatheson.com/2021/05/30/irrigation-pipe-clips</id><content type="html" xml:base="https://brendonmatheson.com/2021/05/30/irrigation-pipe-clips.html"><![CDATA[<p>Here’s a quick post about another functional print for our Bangkok condo.  This is an example of what I love about 3D printing - the ability to come up with elegant, purpose-built solutions for problems that have an addressable market of 1.</p>

<p>A few weeks back we renovated our balcony in Bangkok and as part of that exercise I completely re-installed the drip irrigation system that waters our many plants.</p>

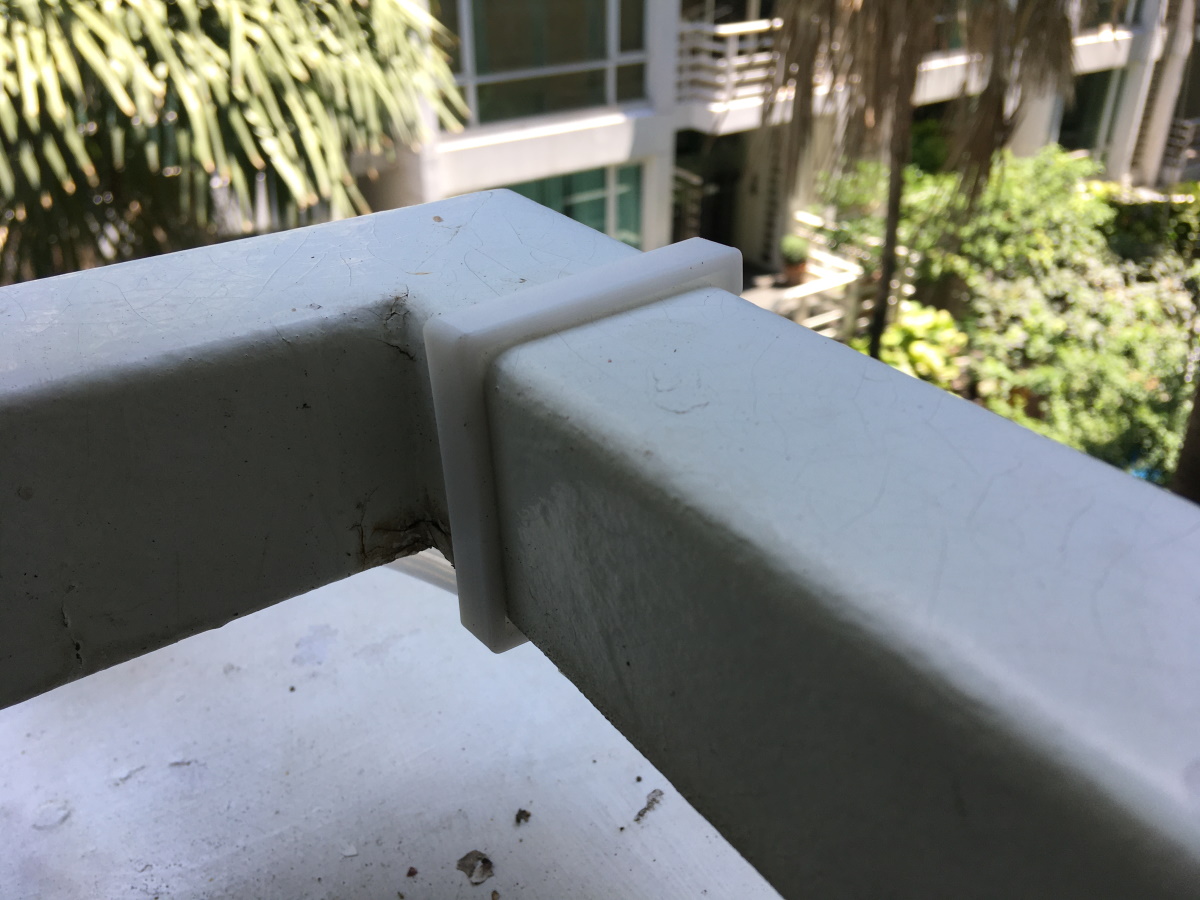
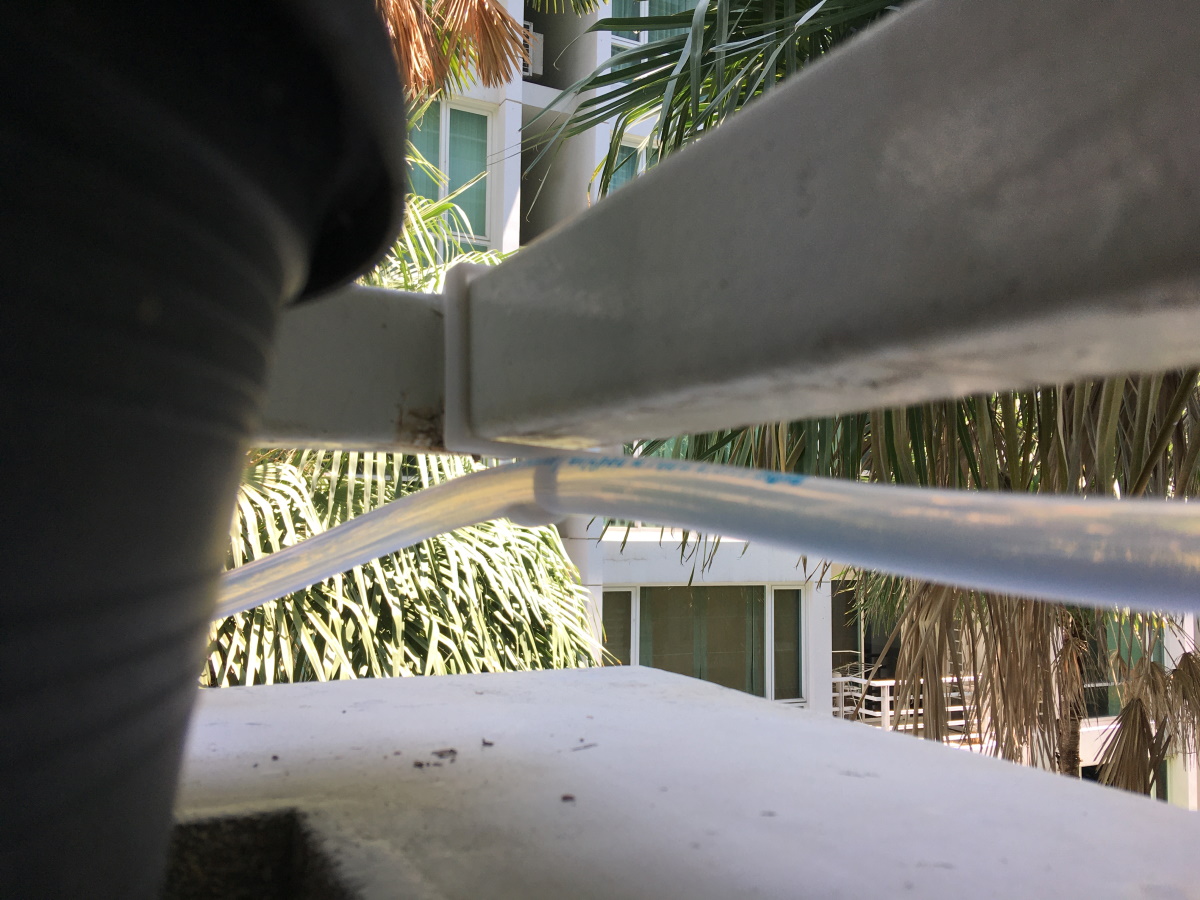
<p>In the original install I had the flexible pipe just running along the tiles behind the pots.  The problem with this that the pipe becomes a dirt trap, collecting soil particles and leaves behind it.  For the re-install I wanted to get the pipe off the ground and thought maybe I could fabricate some clips to hold it under the lowest level of the balcony railing which would also put it somewhat out of sight as an added benefit.</p>

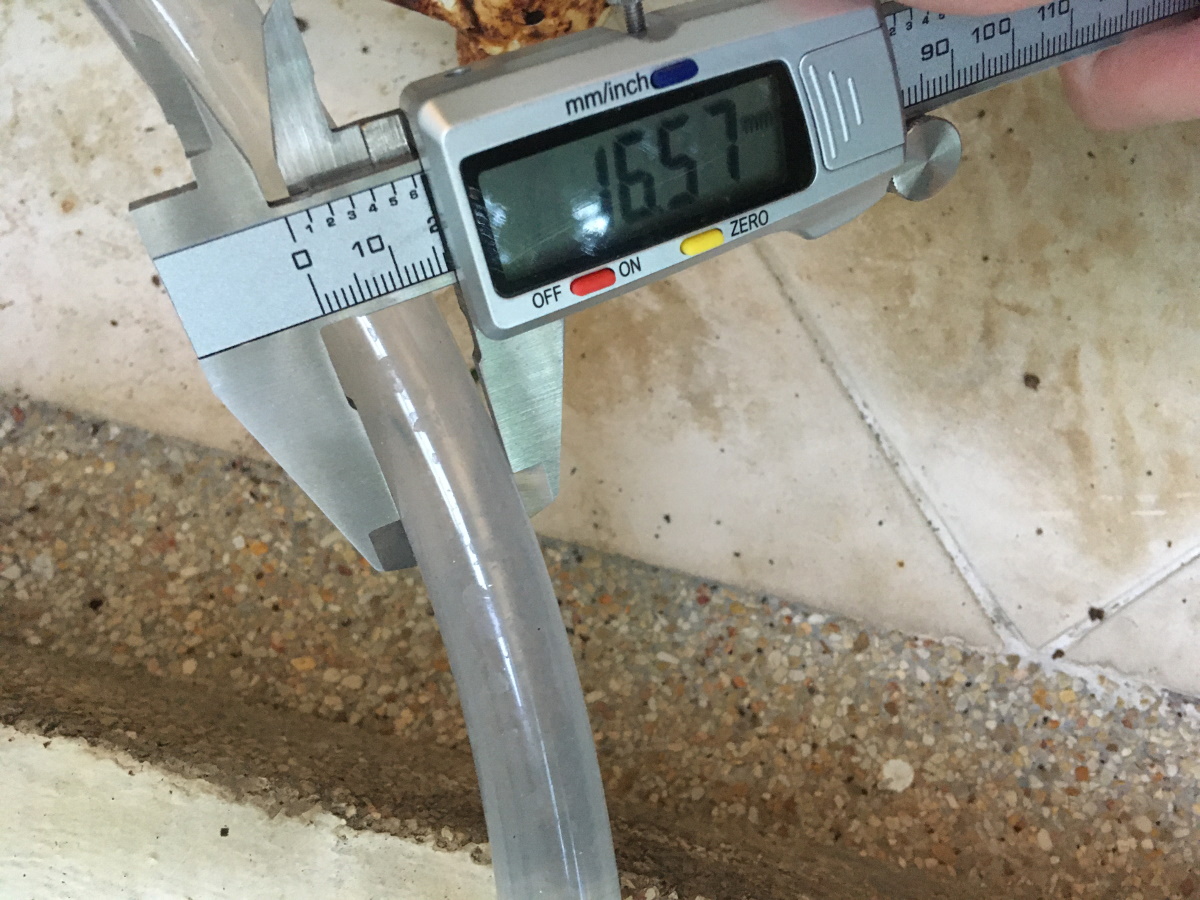
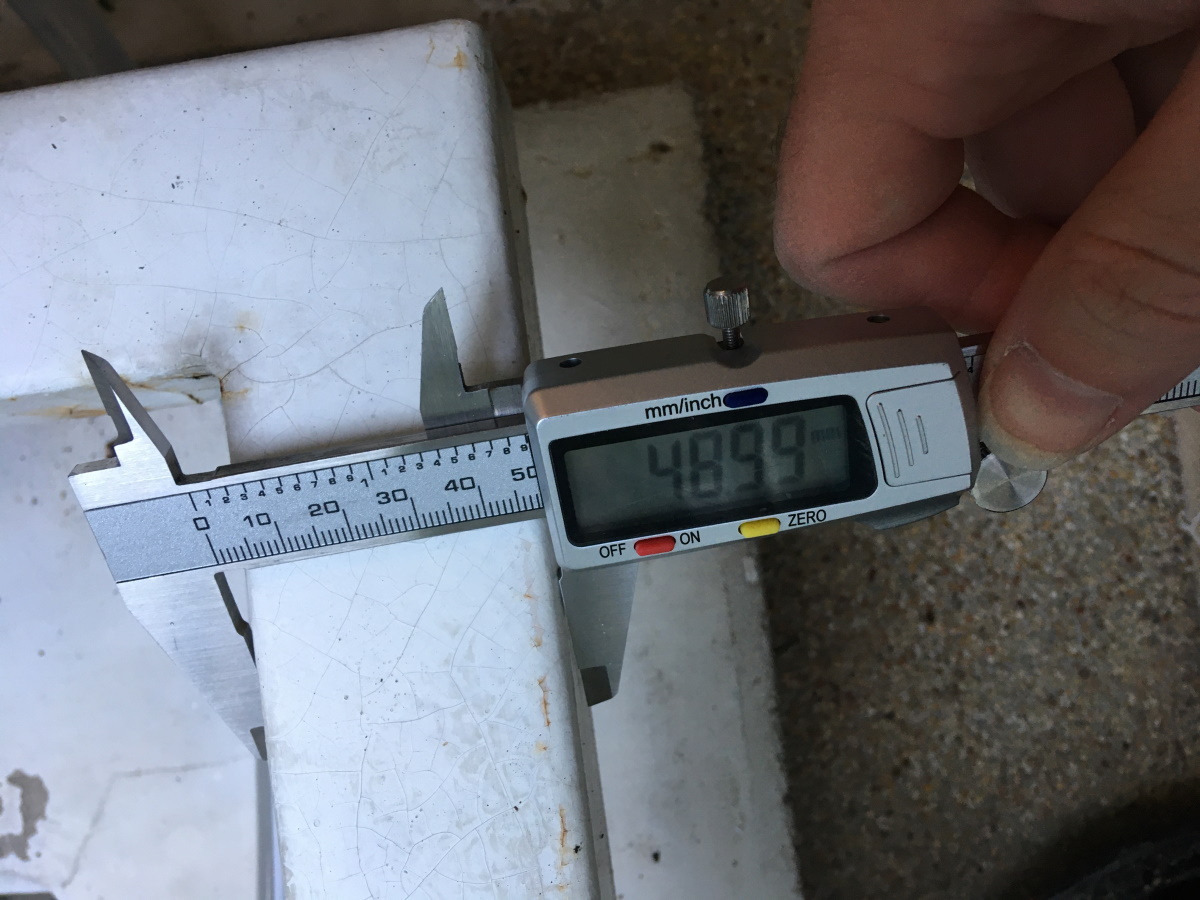
<p>I took some quick dimensions of the pipe and the railing:</p>

<p><img src="/content/2021/2021-05-30-irrigation-pipe-clips/IMG_0799.JPG" alt="" class="img-fluid" /></p>

<p><img src="/content/2021/2021-05-30-irrigation-pipe-clips/IMG_0797.JPG" alt="" class="img-fluid" /></p>

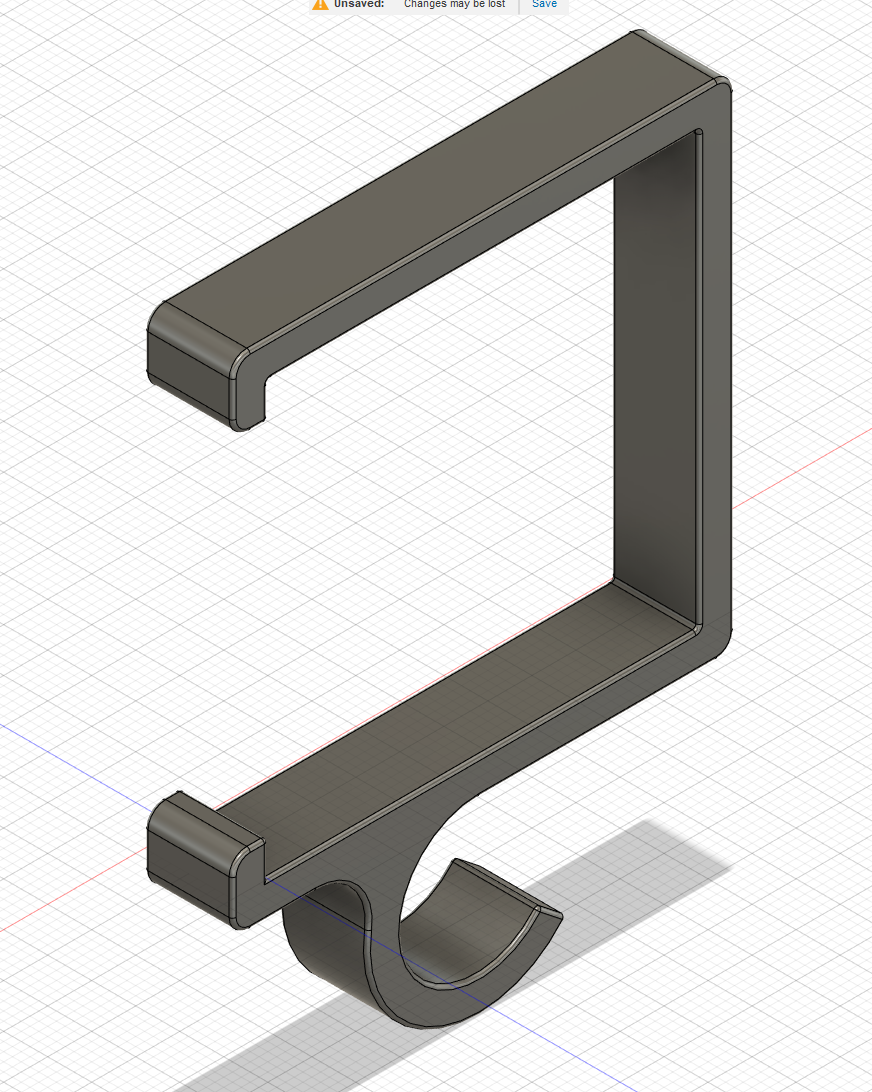
<p>Then sketched the shape in Fusion360 - this took all of 5 minutes:</p>

<p><img src="/content/2021/2021-05-30-irrigation-pipe-clips/design.png" alt="" class="img-fluid" /></p>

<p>It took 3 or 4 iterations of printing and testing to get the shape dialed in.  The adjustments were reducing the inner dimension to make the clip hold onto the railing tightly, and progressively thickening the shape and increasing infill to make it stronger.</p>

<p>Here’s the test of the one that became the final version:</p>

<p><img src="/content/2021/2021-05-30-irrigation-pipe-clips/IMG_0802.JPG" alt="" class="img-fluid" /></p>

<p><img src="/content/2021/2021-05-30-irrigation-pipe-clips/IMG_0803.JPG" alt="" class="img-fluid" /></p>

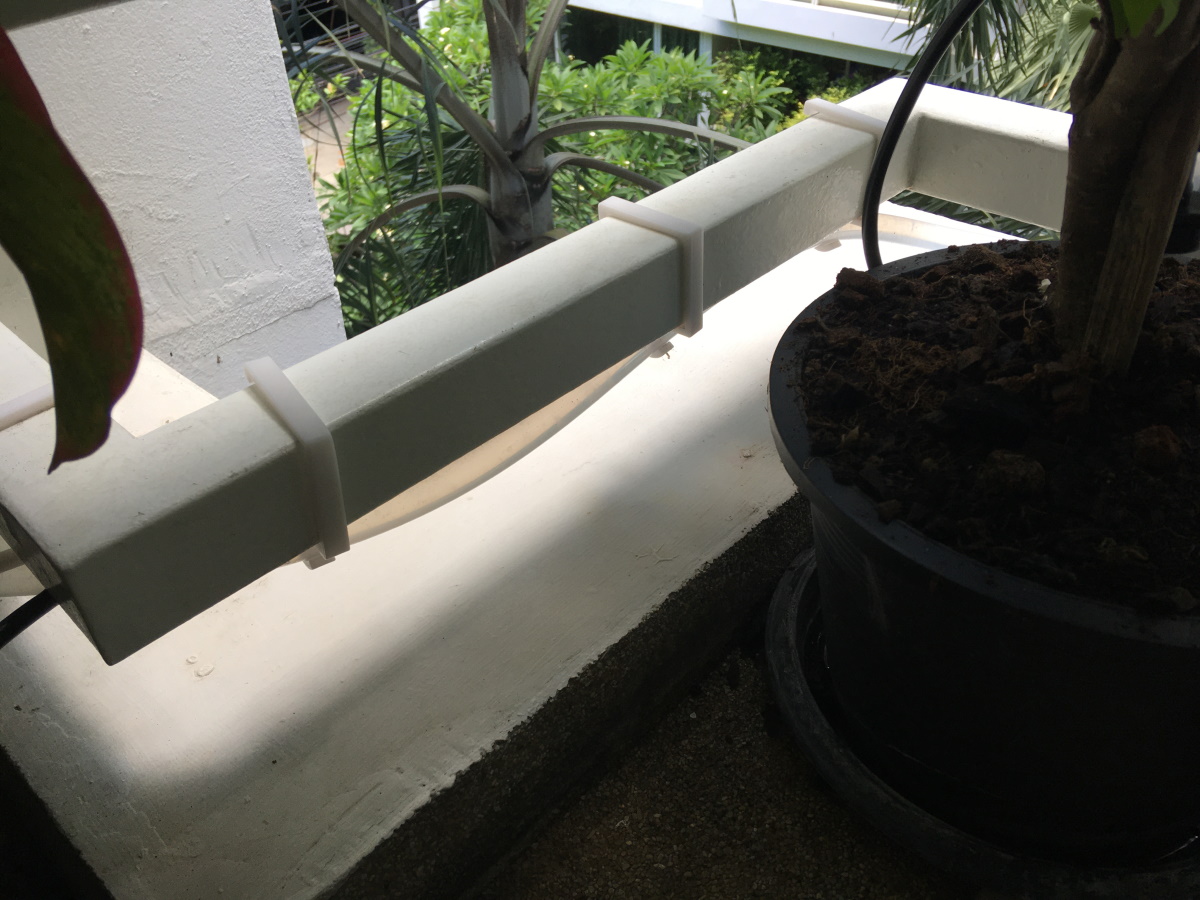
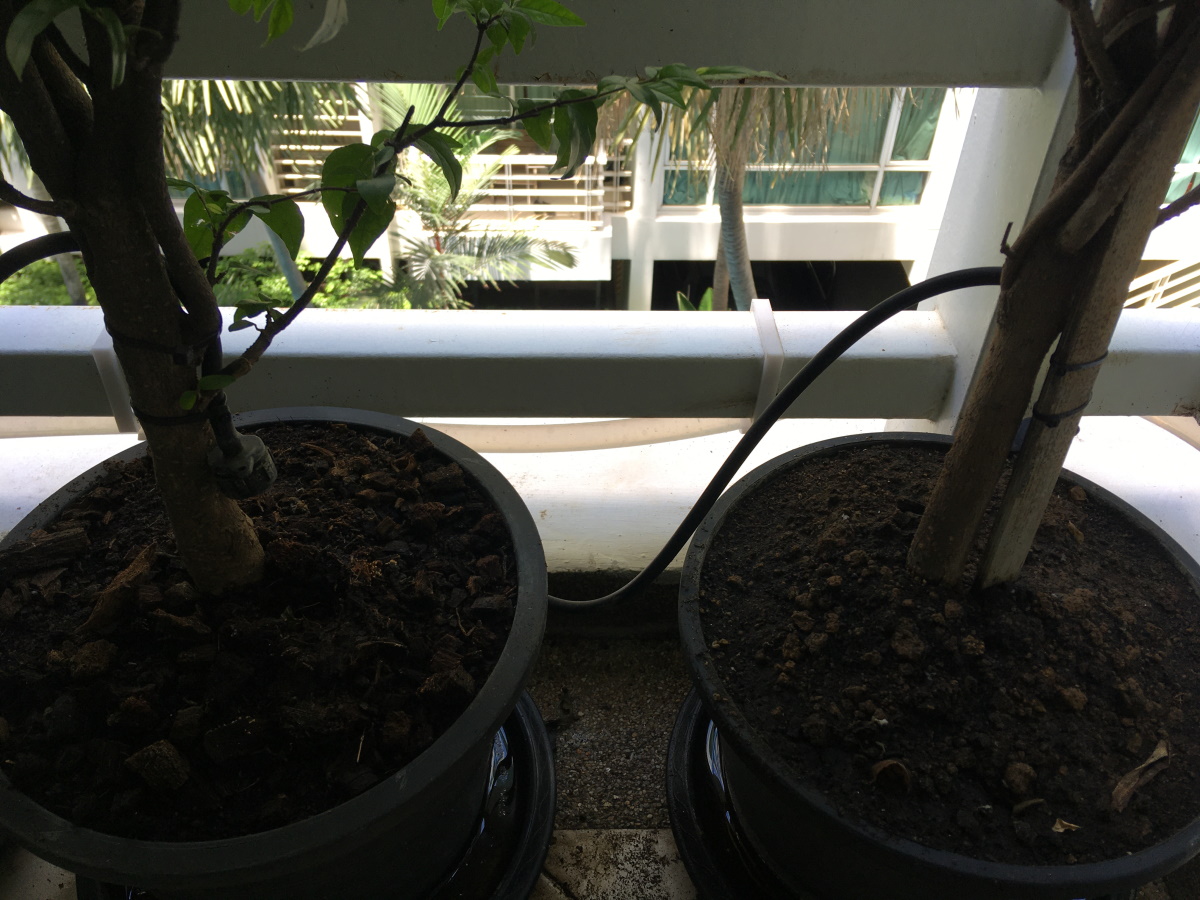
<p>With the model finalized I printed 14 of them out and did the final installation:</p>

<p><img src="/content/2021/2021-05-30-irrigation-pipe-clips/IMG_0879.JPG" alt="" class="img-fluid" /></p>

<p><img src="/content/2021/2021-05-30-irrigation-pipe-clips/IMG_0880.JPG" alt="" class="img-fluid" /></p>

<p>The result was good.  The clips are strong and haven’t deformed after being under load for a couple of weeks now, and the irrigation pipe is now mostly out of sight and more importantly is off the tiles making it easier for us to keep the balcony clean.</p>

<p>It remains to be seen if these PLA prints last long-term being exposed to the rain and sun - will be interesting to check back in on them in 6 months.</p>]]></content><author><name></name></author><category term="3dprinting" /><category term="farming" /><summary type="html"><![CDATA[Here’s a quick post about another functional print for our Bangkok condo. This is an example of what I love about 3D printing - the ability to come up with elegant, purpose-built solutions for problems that have an addressable market of 1.]]></summary></entry><entry><title type="html">Drop File Box With 3D Printed Rails</title><link href="https://brendonmatheson.com/2021/05/26/drop-file-box-with-3d-printed-rails.html" rel="alternate" type="text/html" title="Drop File Box With 3D Printed Rails" /><published>2021-05-26T11:35:00+00:00</published><updated>2021-05-26T11:35:00+00:00</updated><id>https://brendonmatheson.com/2021/05/26/drop-file-box-with-3d-printed-rails</id><content type="html" xml:base="https://brendonmatheson.com/2021/05/26/drop-file-box-with-3d-printed-rails.html"><![CDATA[<p>A while back I had a small under desk Ikea drawer unit with a drawer for <a href="https://www.ikea.com/th/en/p/summera-drop-file-patterned-00252267/">Ikea Summera drop files</a>.  This was great for a while but eventually the drawer filled up and I decided the drawer unit took up too much floor space, so I moved the files to a plastic tub and sold the drawers on CraigsList.</p>

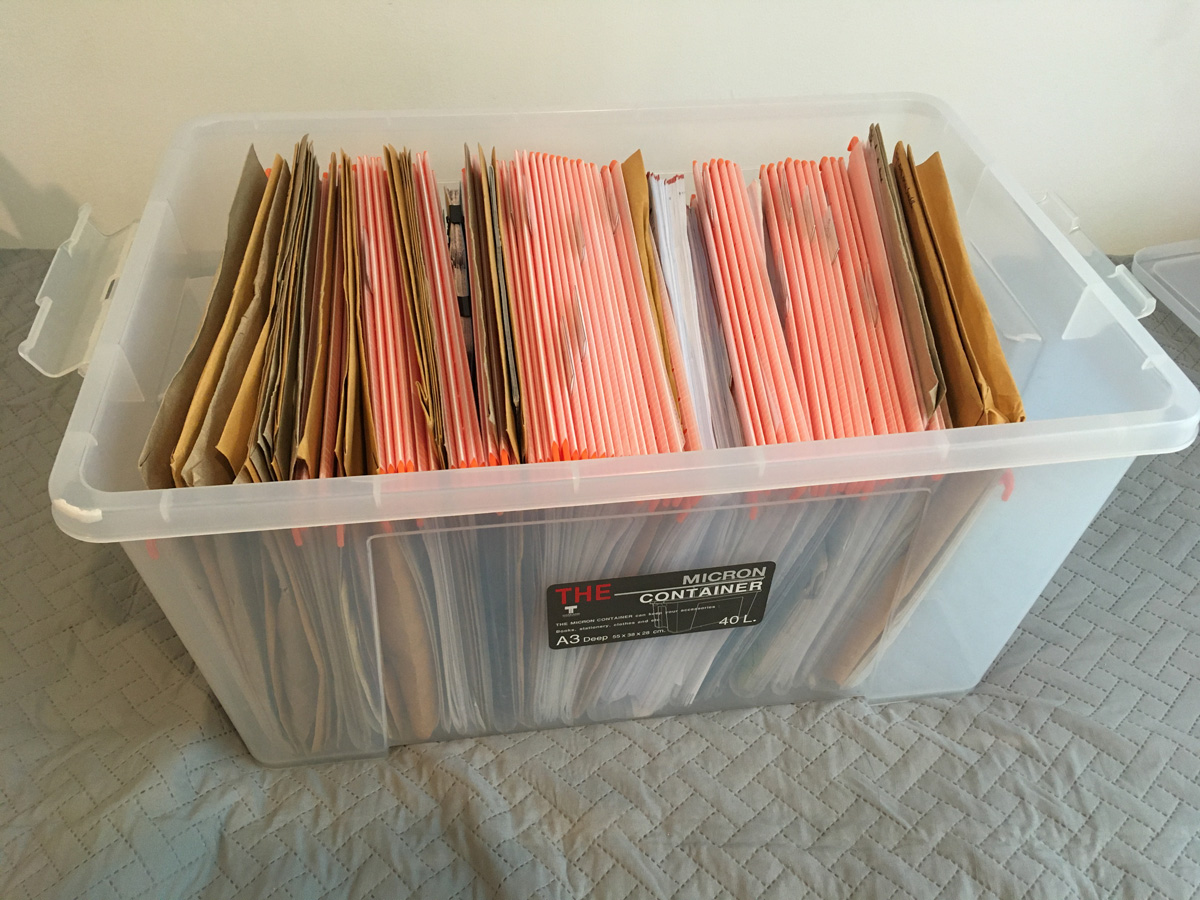
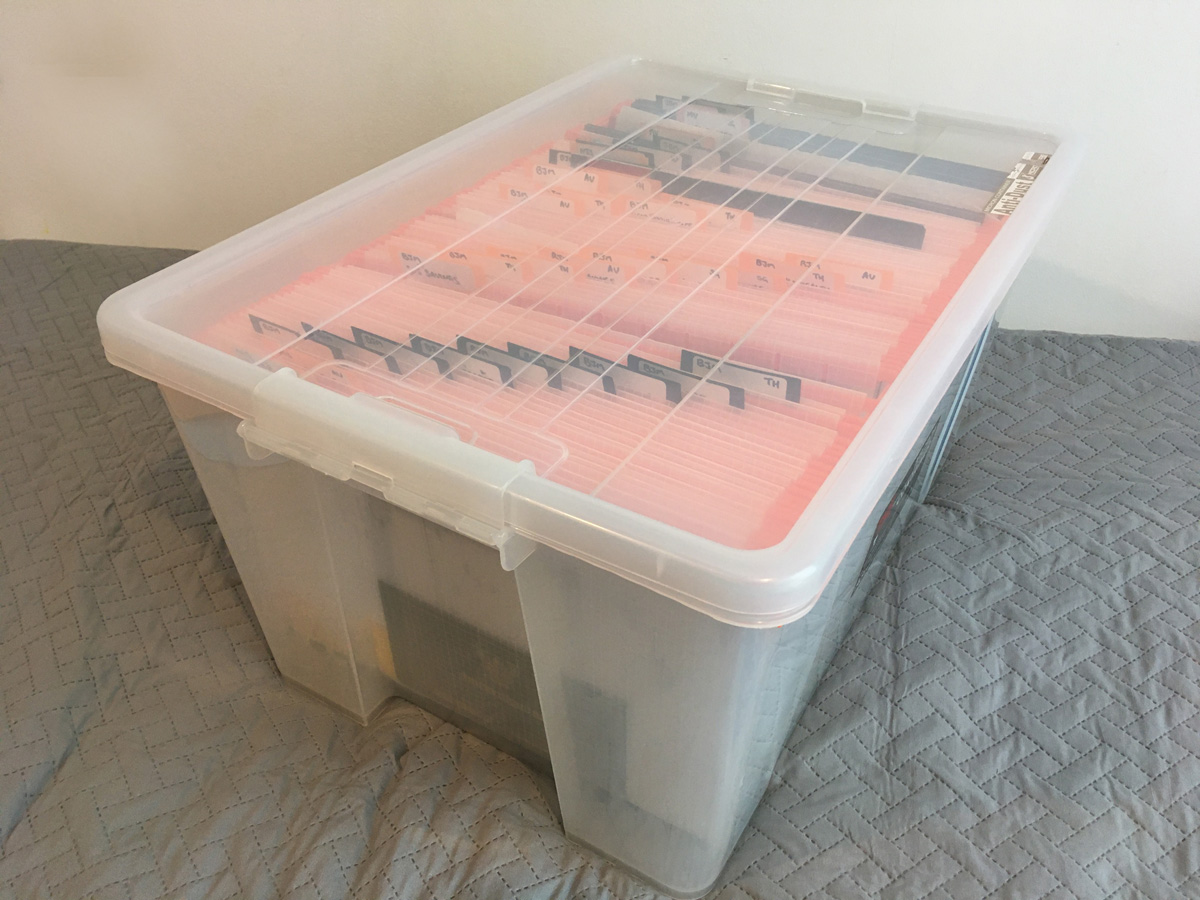
<p><img src="/content/2021/2021-05-26-drop-file-box-with-3d-printed-rails/IMG_0853.JPG" alt="" class="img-fluid" /></p>

<p>This was an improvement in that the box held more files and could be stored in a cupboard of the way - however accessing the files was kind of a problem because they were just jammed in together so it was hard to flick through them, and if you took too many files out at once the remaining ones would start to slide around in the container.</p>

<p><img src="/content/2021/2021-05-26-drop-file-box-with-3d-printed-rails/IMG_0854.JPG" alt="" class="img-fluid" /></p>

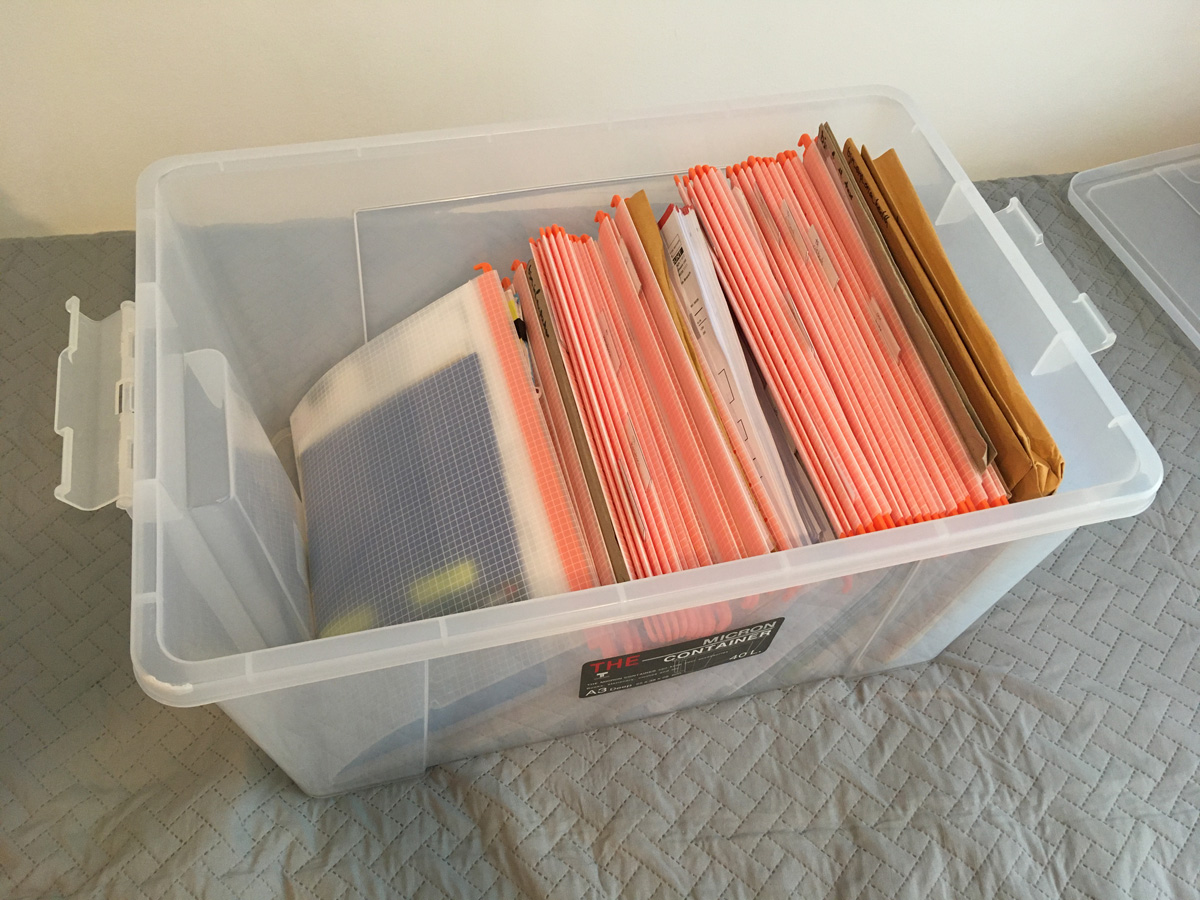
<p>Recently I had the idea to 3D print some rails to hang the files inside the box - and it worked out better than I expected.</p>

<p>Here’s a brief rundown of the project.</p>

<h1 id="container">Container</h1>

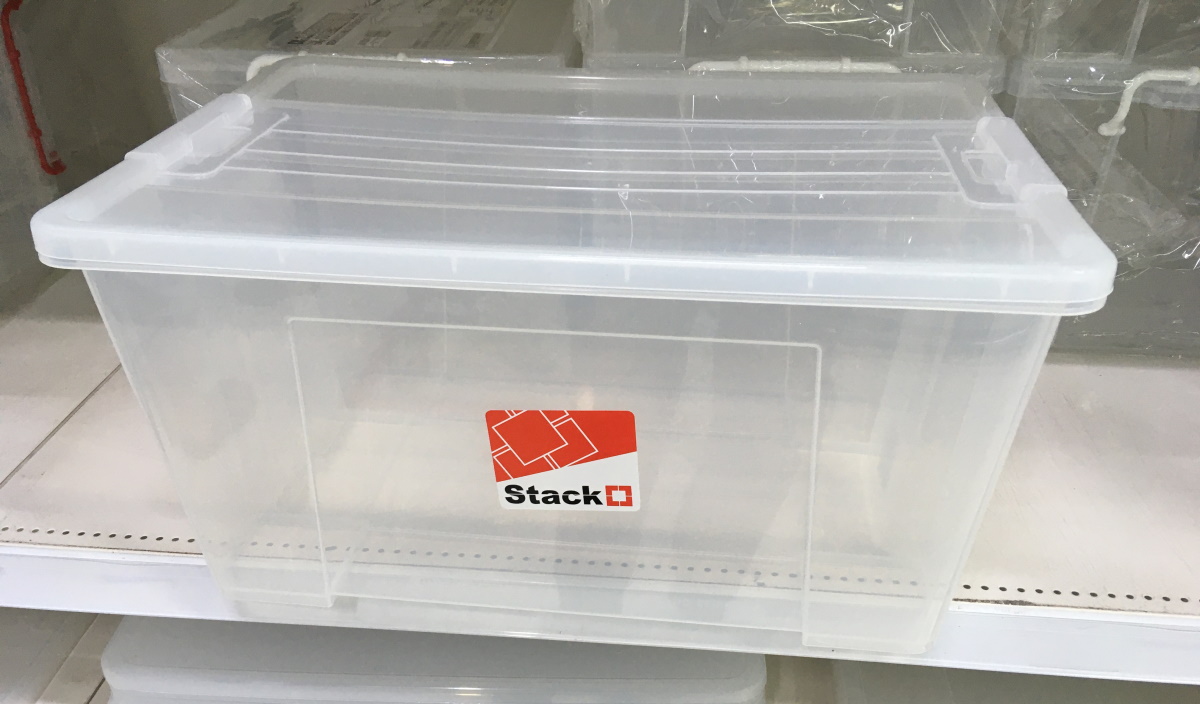
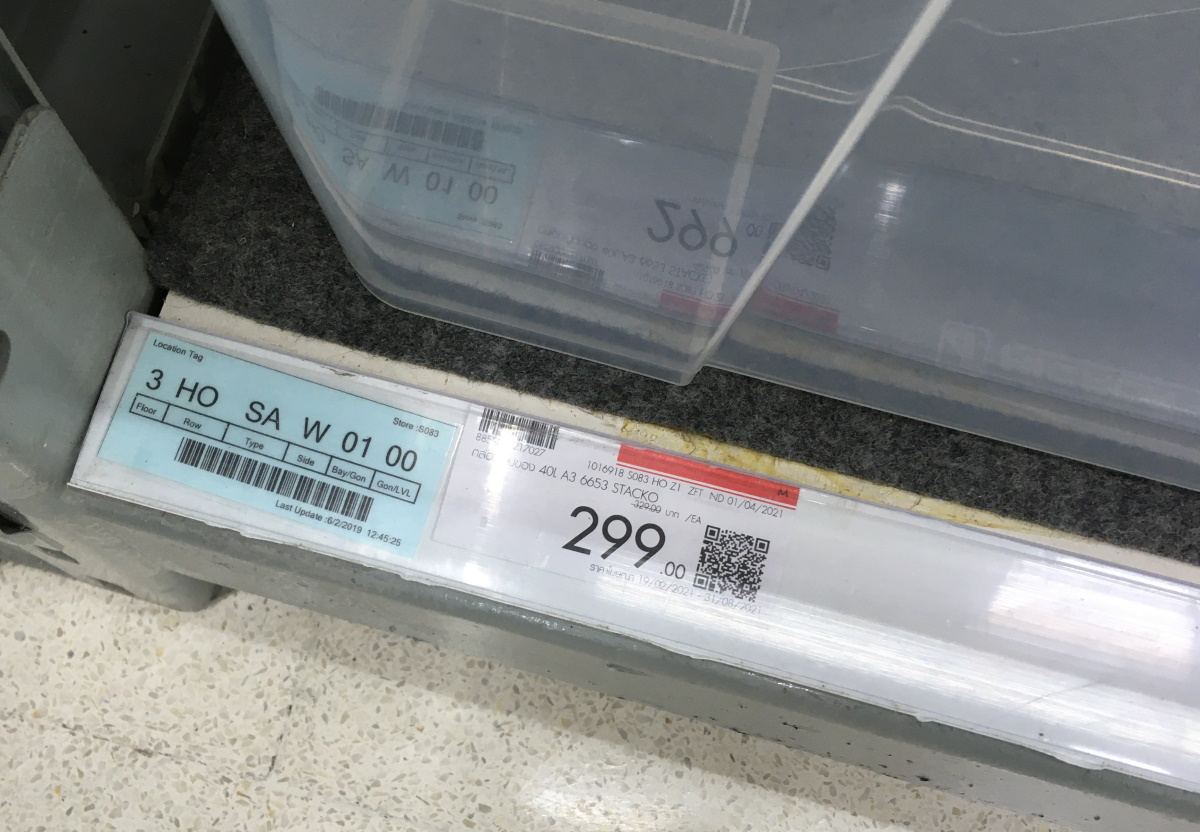
<p>The container I have is a 40 litre “Micron” brand - it is the absolute perfect size for the Ikea Summera drop files.  I recently found exactly the <a href="https://www.homepro.co.th/p/1016918">same container at HomePro</a> under the “Stacko” brand for 299 baht.</p>

<p><img src="/content/2021/2021-05-26-drop-file-box-with-3d-printed-rails/IMG_0738.JPG" alt="" class="img-fluid" /></p>

<p><img src="/content/2021/2021-05-26-drop-file-box-with-3d-printed-rails/IMG_0739.JPG" alt="" class="img-fluid" /></p>

<h1 id="rails">Rails</h1>

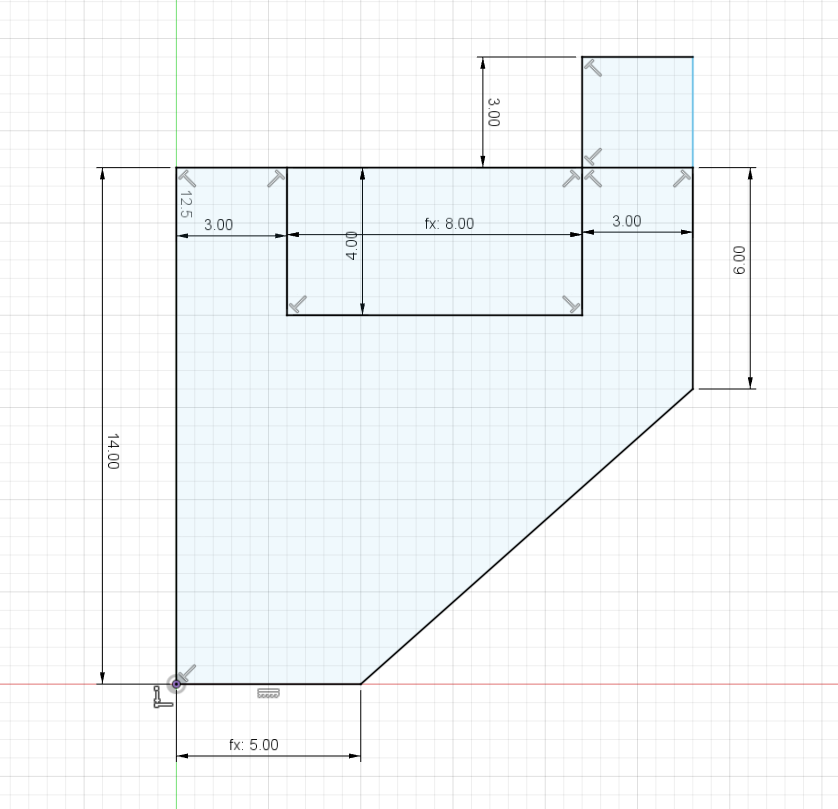
<p>After a few iterations of measuring, eyeballing and trial-and-error test prints I came up with this profile for the rails:</p>

<p><img src="/content/2021/2021-05-26-drop-file-box-with-3d-printed-rails/profile.png" alt="" class="img-fluid" /></p>

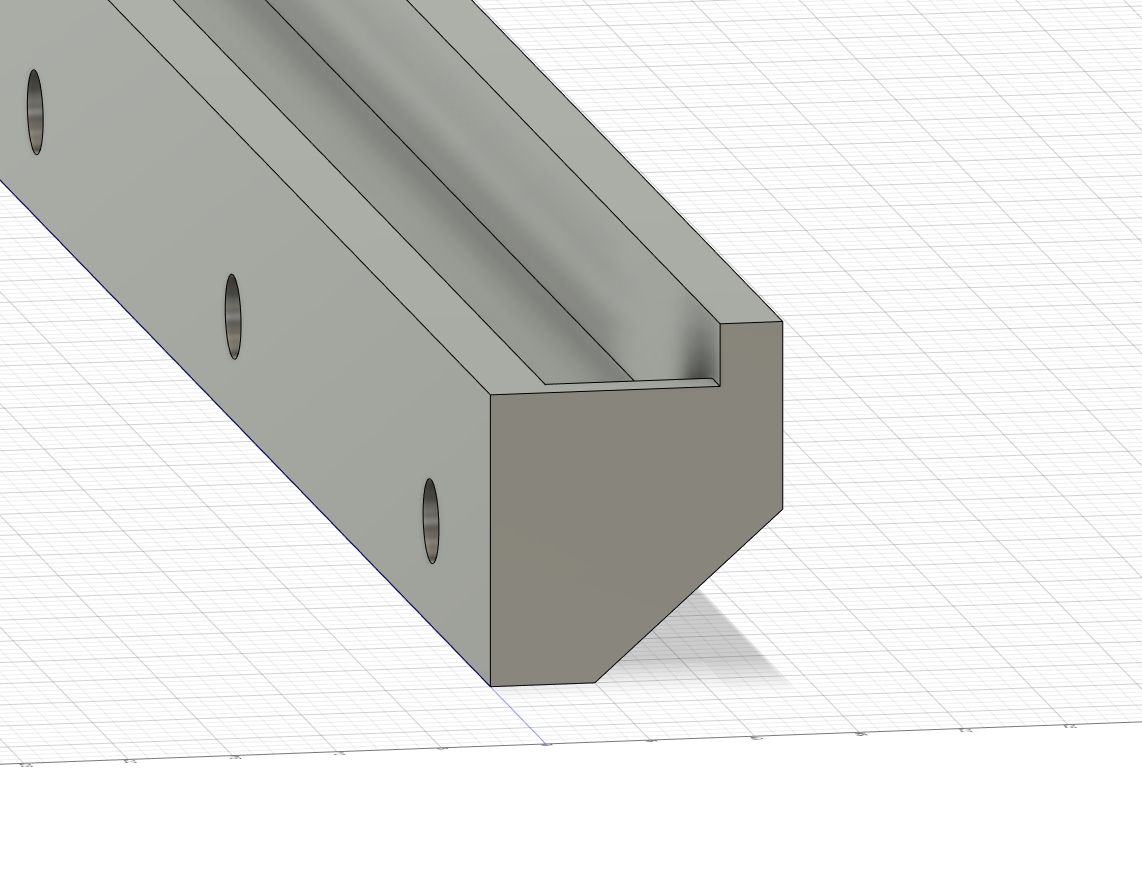
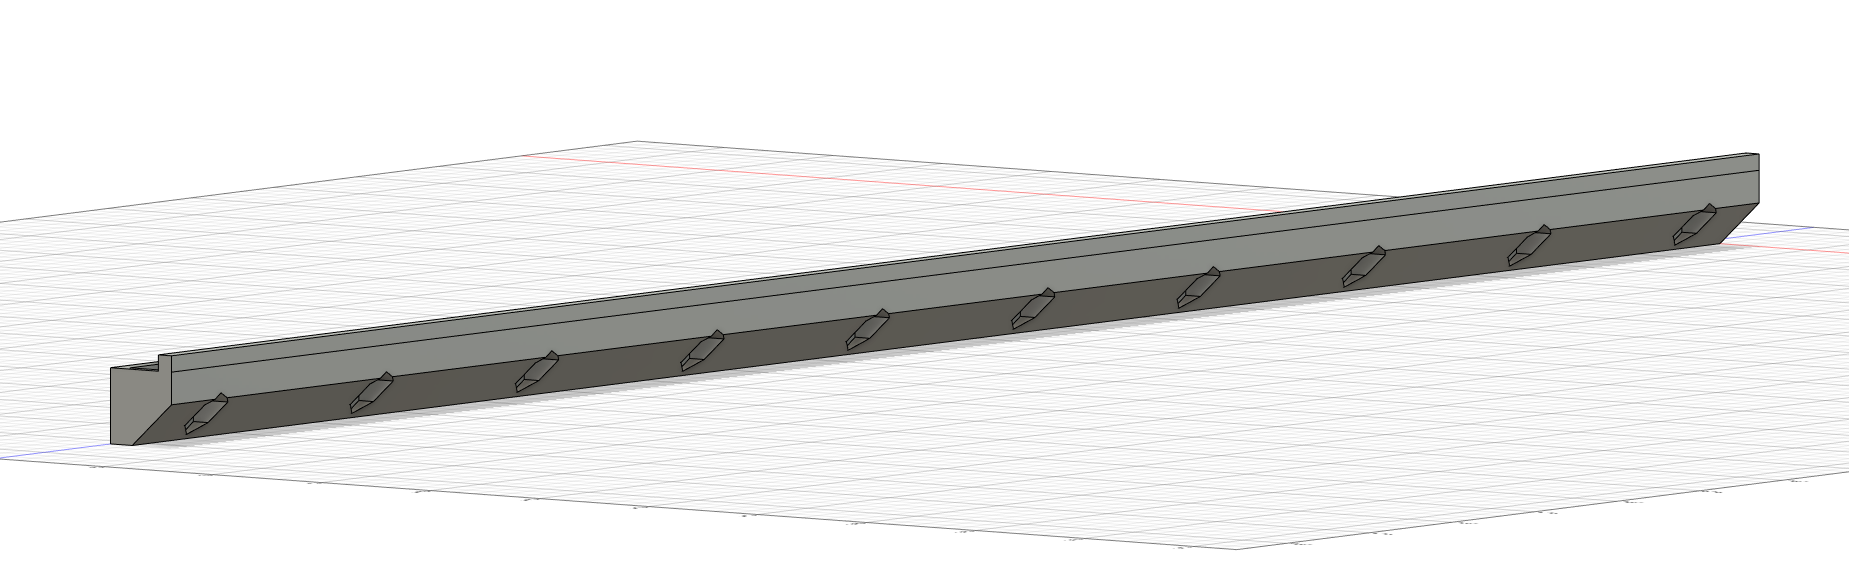
<p>I extruded the rails out with end-stops, and cut holes for M4 bolts and captive sockets for the hex nuts:</p>

<p><img src="/content/2021/2021-05-26-drop-file-box-with-3d-printed-rails/screenshot_03.png" alt="" class="img-fluid" /></p>

<p><img src="/content/2021/2021-05-26-drop-file-box-with-3d-printed-rails/screenshot_02.png" alt="" class="img-fluid" /></p>

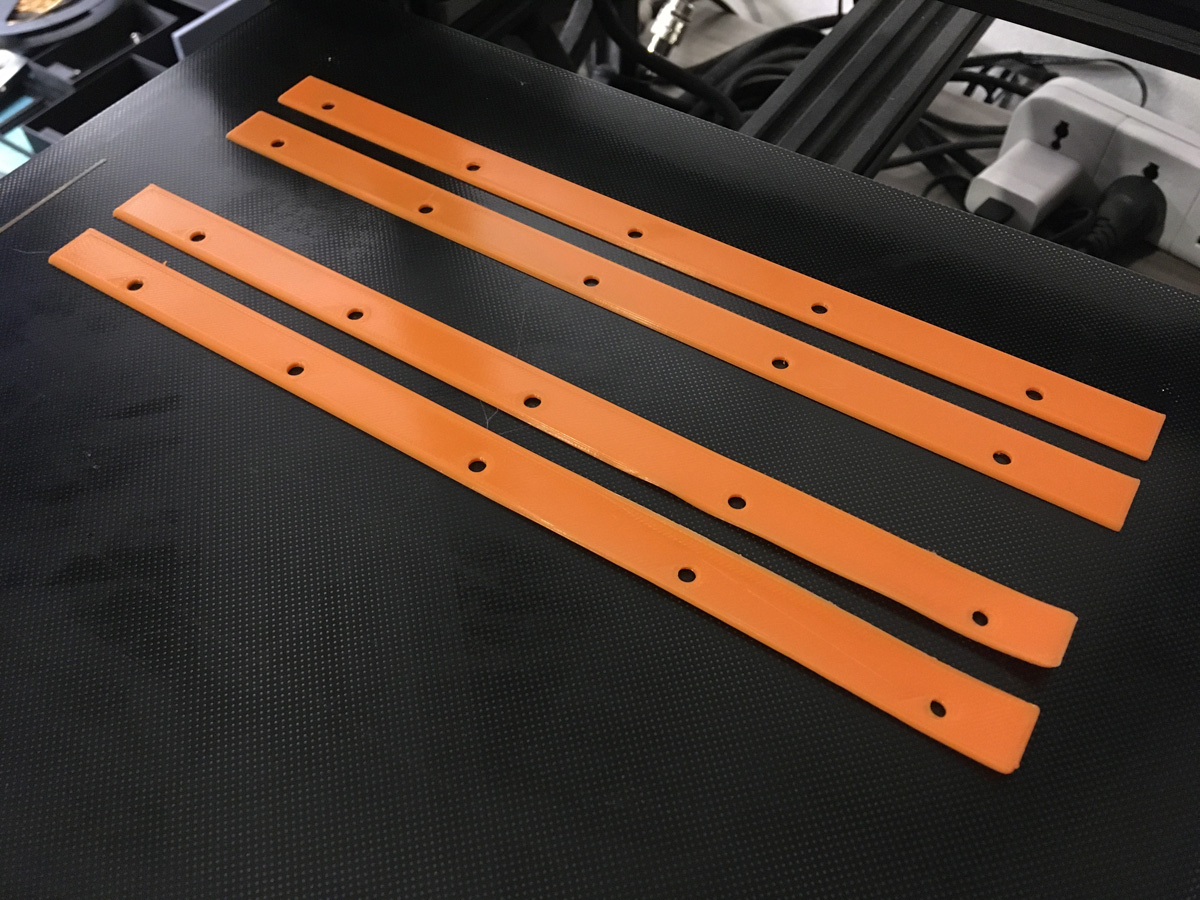
<p>Given the length, I split the rail body in two to fit on my 300mm square CR10S printer bed.  I printed them with brims for adhesion and tree supports for the minimal amount of support that was required in the overhangs of the hex nut sockets  - the print quality was gorgeous:</p>

<p><img src="/content/2021/2021-05-26-drop-file-box-with-3d-printed-rails/IMG_0726.JPG" alt="" class="img-fluid" /></p>

<p>I decided to print face plates to go on the outside, rather than having the heads of the bolts directly against the outside of the crate, both for some additional robustness as well as for aesthetics.  Unfortunately I elected not to use brims this time and two of the parts warped but I didn’t reprint them as I didn’t want to wait.</p>

<p><img src="/content/2021/2021-05-26-drop-file-box-with-3d-printed-rails/IMG_0746.JPG" alt="" class="img-fluid" /></p>

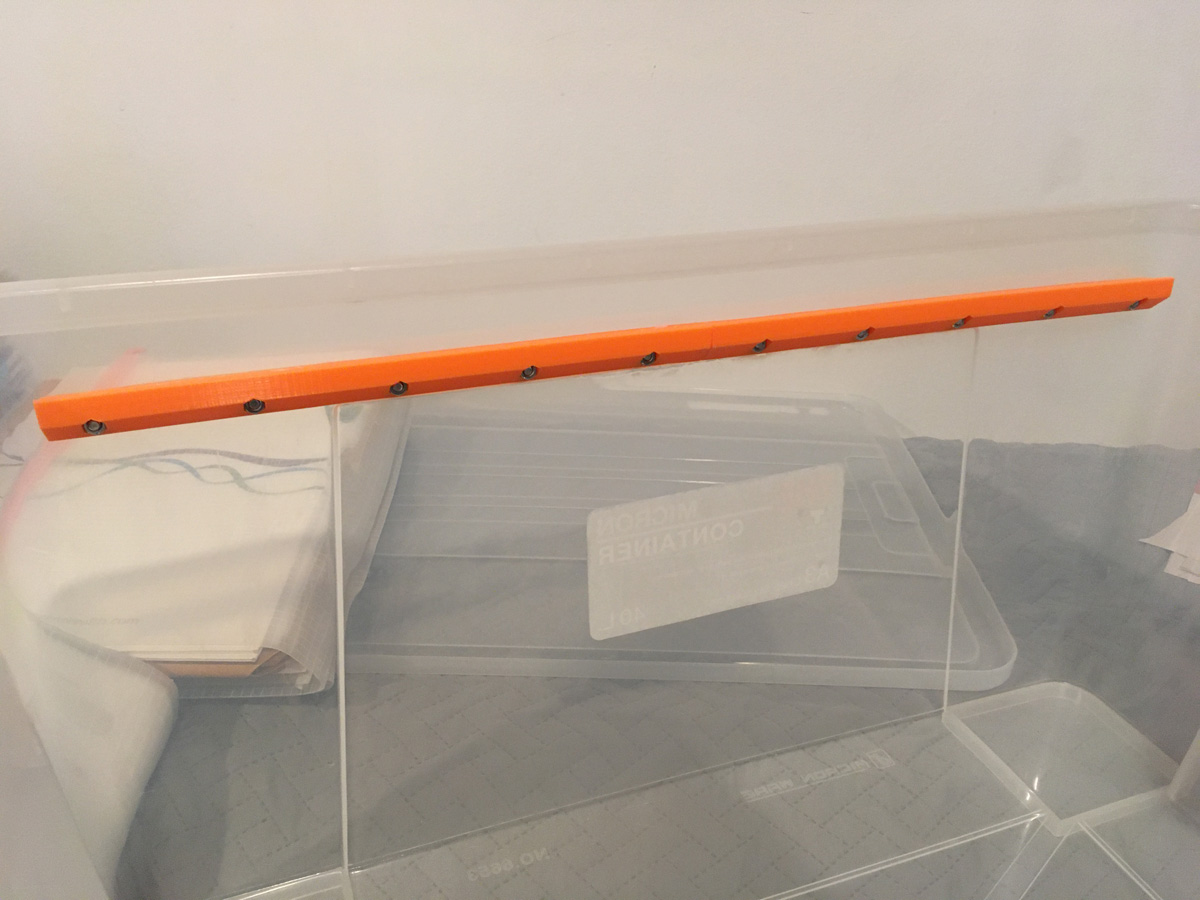
<p>Initially I thought glue would also be a good idea, and I did actually use superglue but it barely adhered - ultimately bolts alone would have been more than enough.  In fact half as many bolts would have been enough.  Here’s the first rail installed:</p>

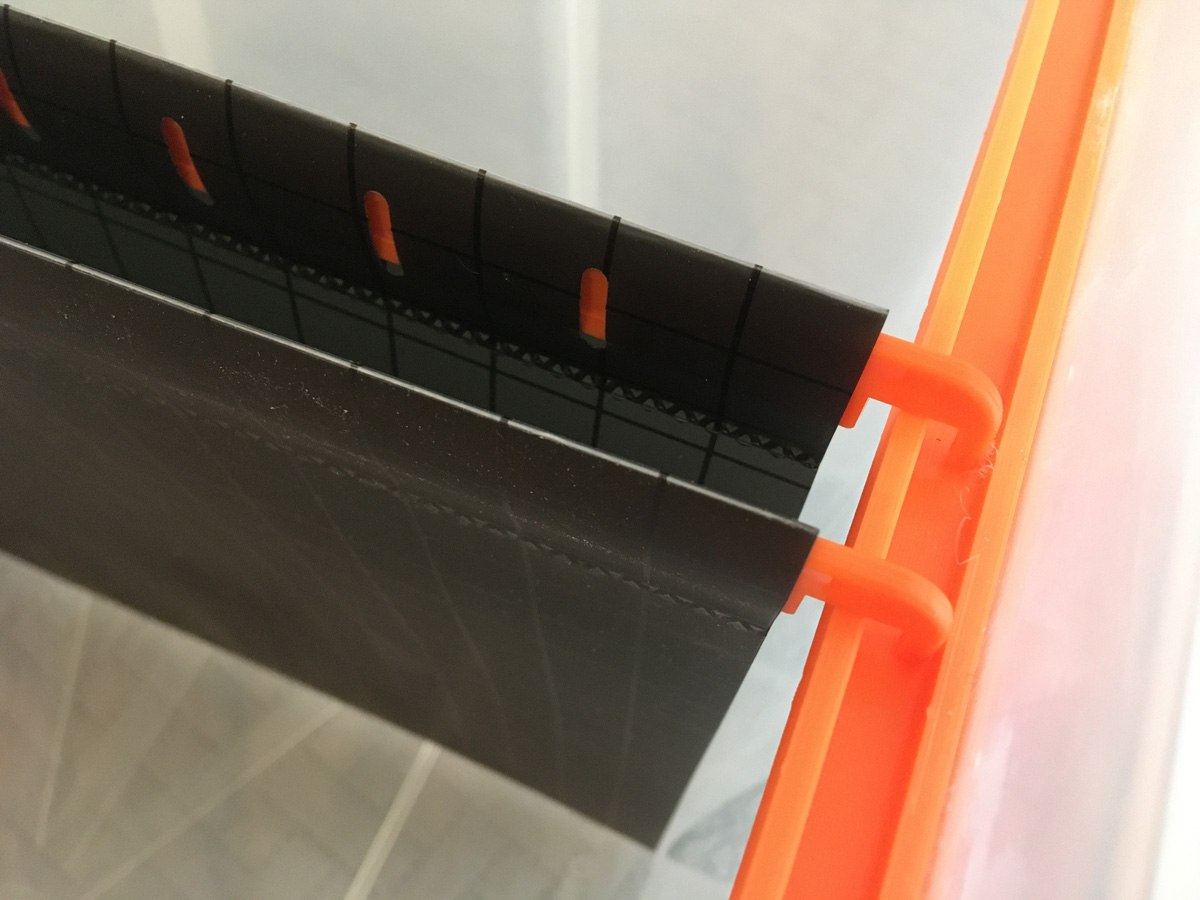
<p><img src="/content/2021/2021-05-26-drop-file-box-with-3d-printed-rails/IMG_0767.JPG" alt="" class="img-fluid" /></p>

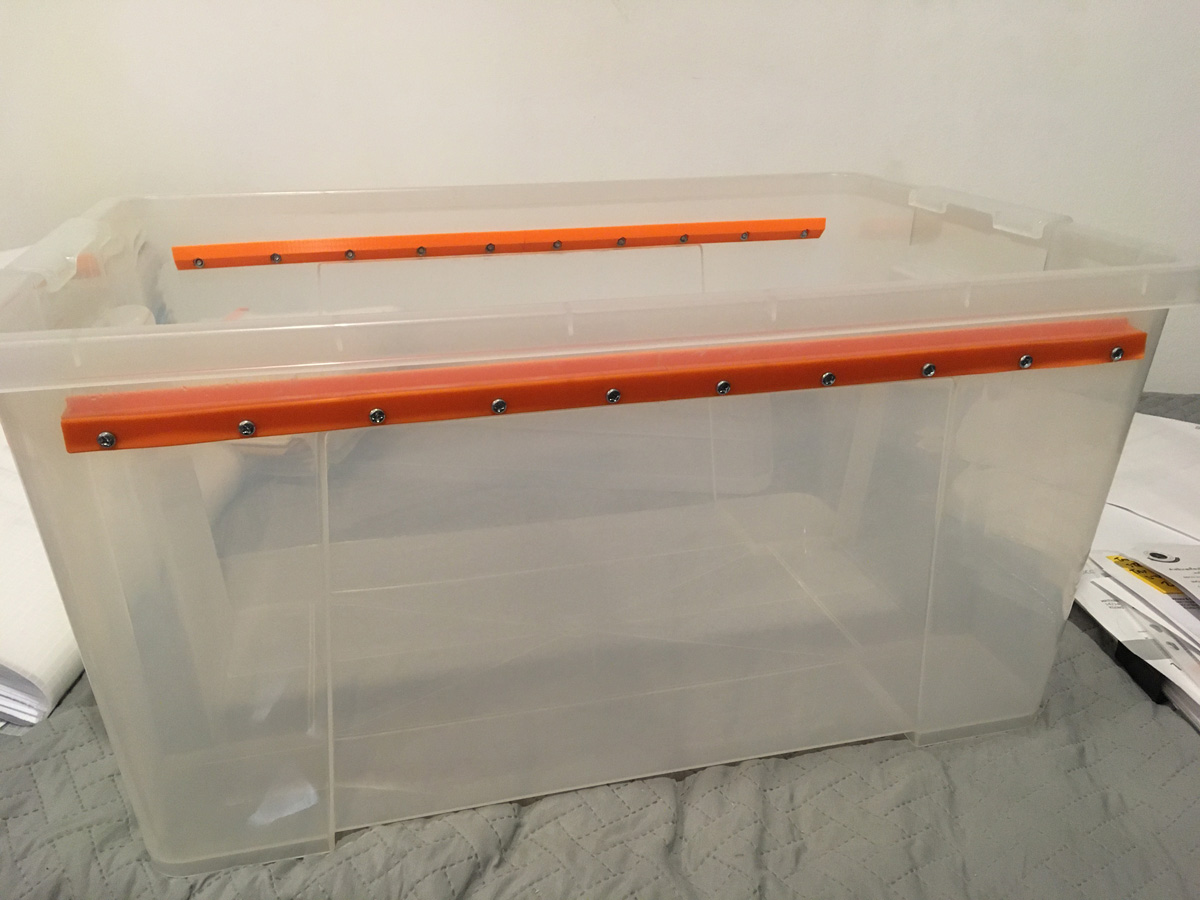
<p>Here’s the empty container now with both rails installed:</p>

<p><img src="/content/2021/2021-05-26-drop-file-box-with-3d-printed-rails/IMG_0766.JPG" alt="" class="img-fluid" /></p>

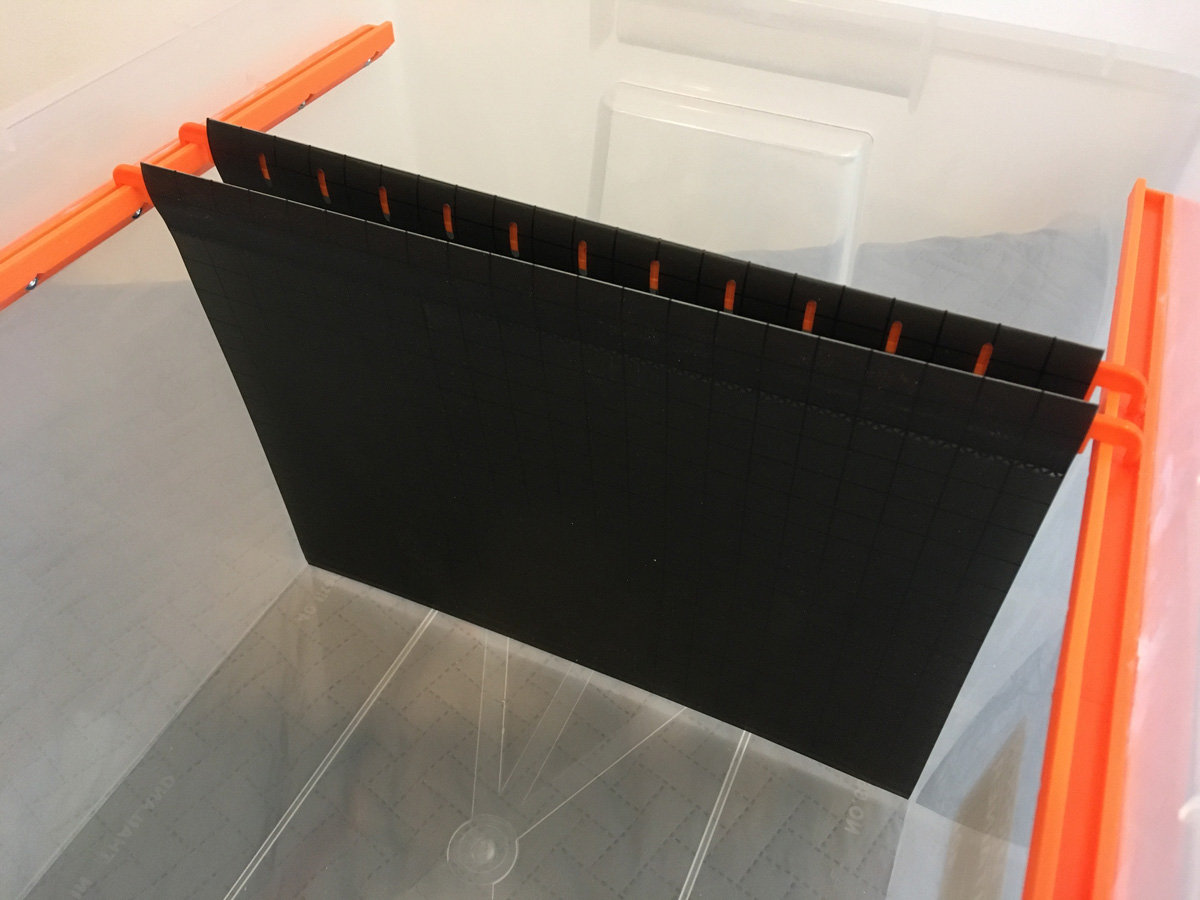
<p>Test file deployment:</p>

<p><img src="/content/2021/2021-05-26-drop-file-box-with-3d-printed-rails/IMG_0851.JPG" alt="" class="img-fluid" /></p>

<p><img src="/content/2021/2021-05-26-drop-file-box-with-3d-printed-rails/IMG_0852.JPG" alt="" class="img-fluid" /></p>

<h1 id="label-tabs">Label Tabs</h1>

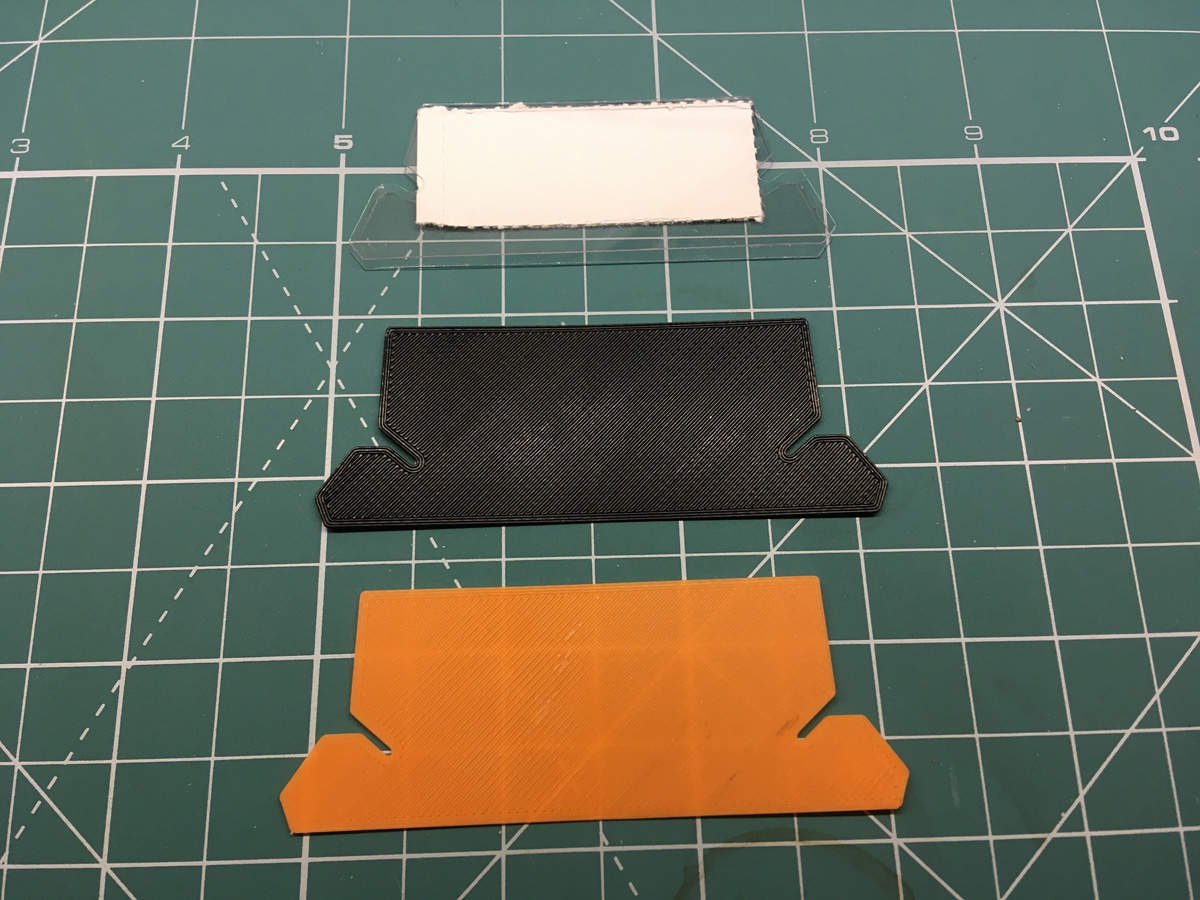
<p>The Ikea files come with plastic labels that clasp a little perforated tear-off card, but somehow I ran out a while ago - more 3D printing to the rescue.</p>

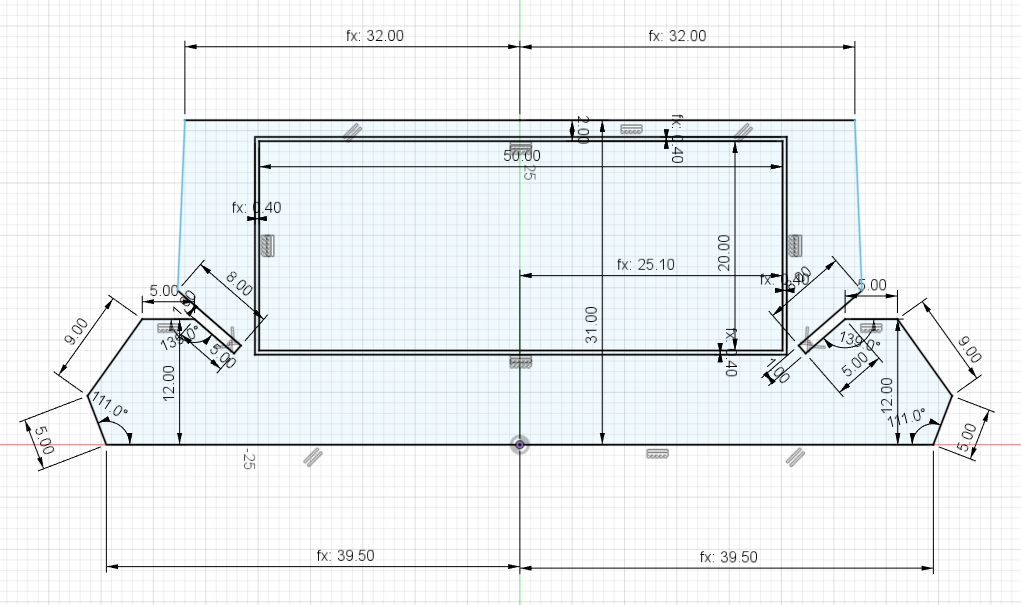
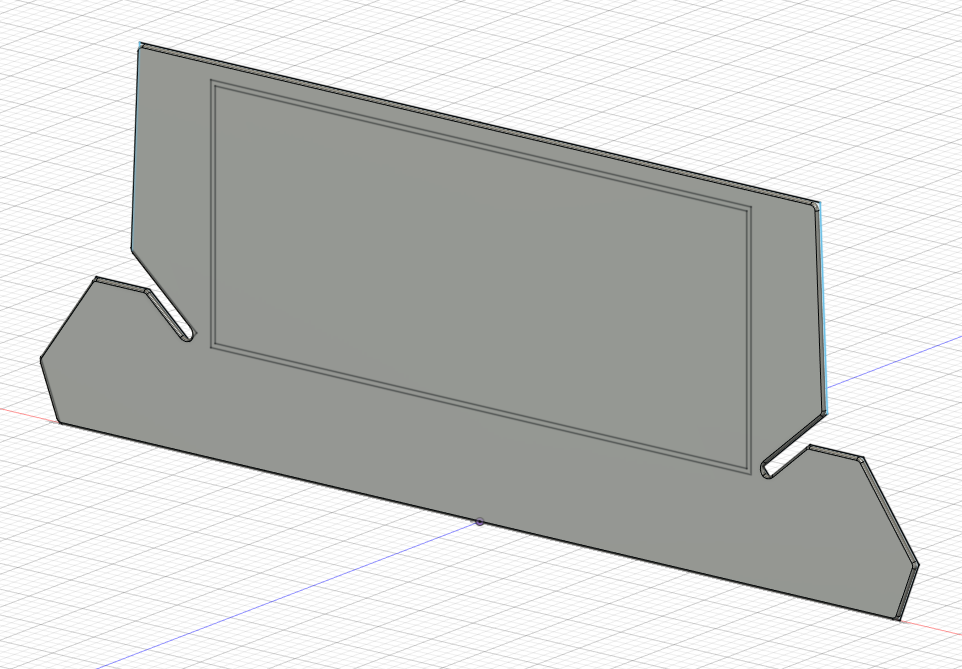
<p>I took some measurements and recreated the tab shape in Fusion360:</p>

<p><img src="/content/2021/2021-05-26-drop-file-box-with-3d-printed-rails/tab_sketch.png" alt="" class="img-fluid" /></p>

<p><img src="/content/2021/2021-05-26-drop-file-box-with-3d-printed-rails/tab_iso.png" alt="" class="img-fluid" /></p>

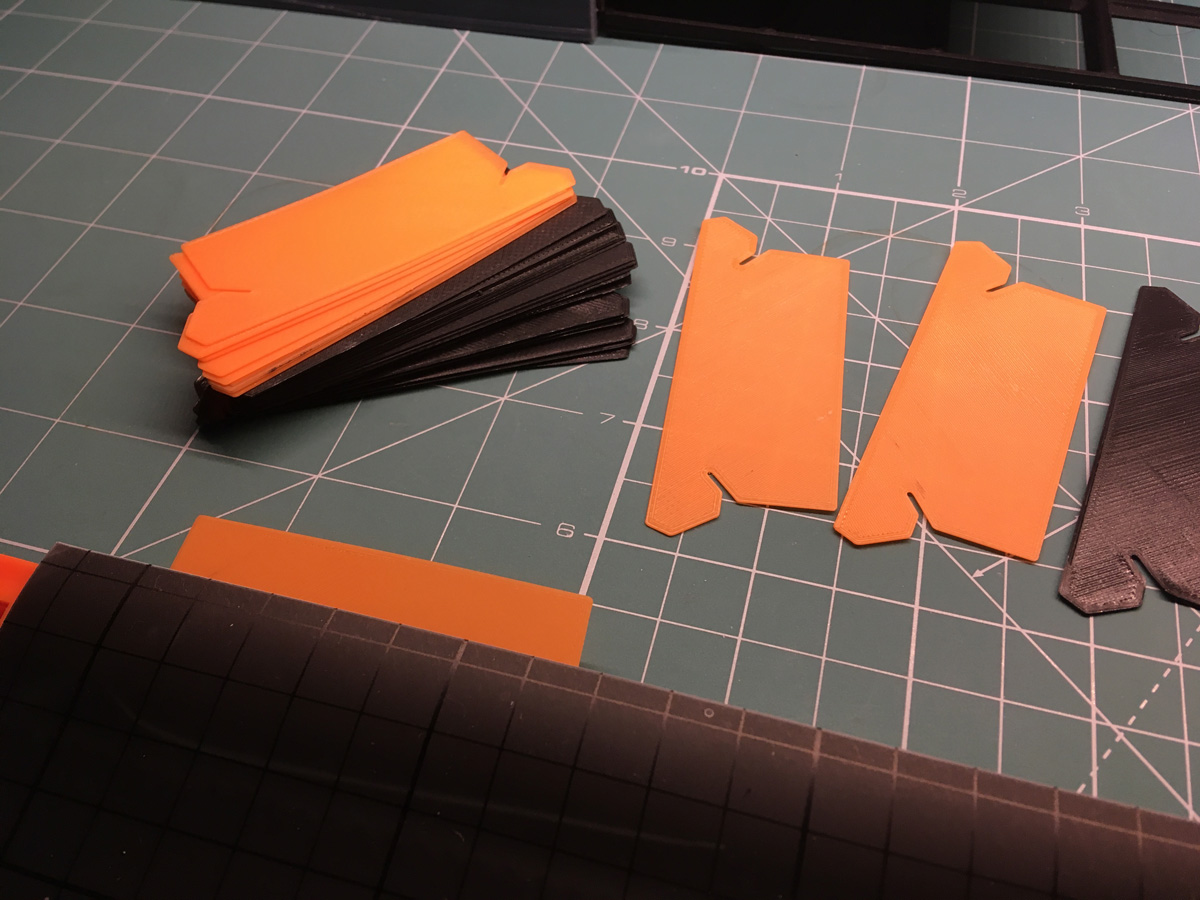
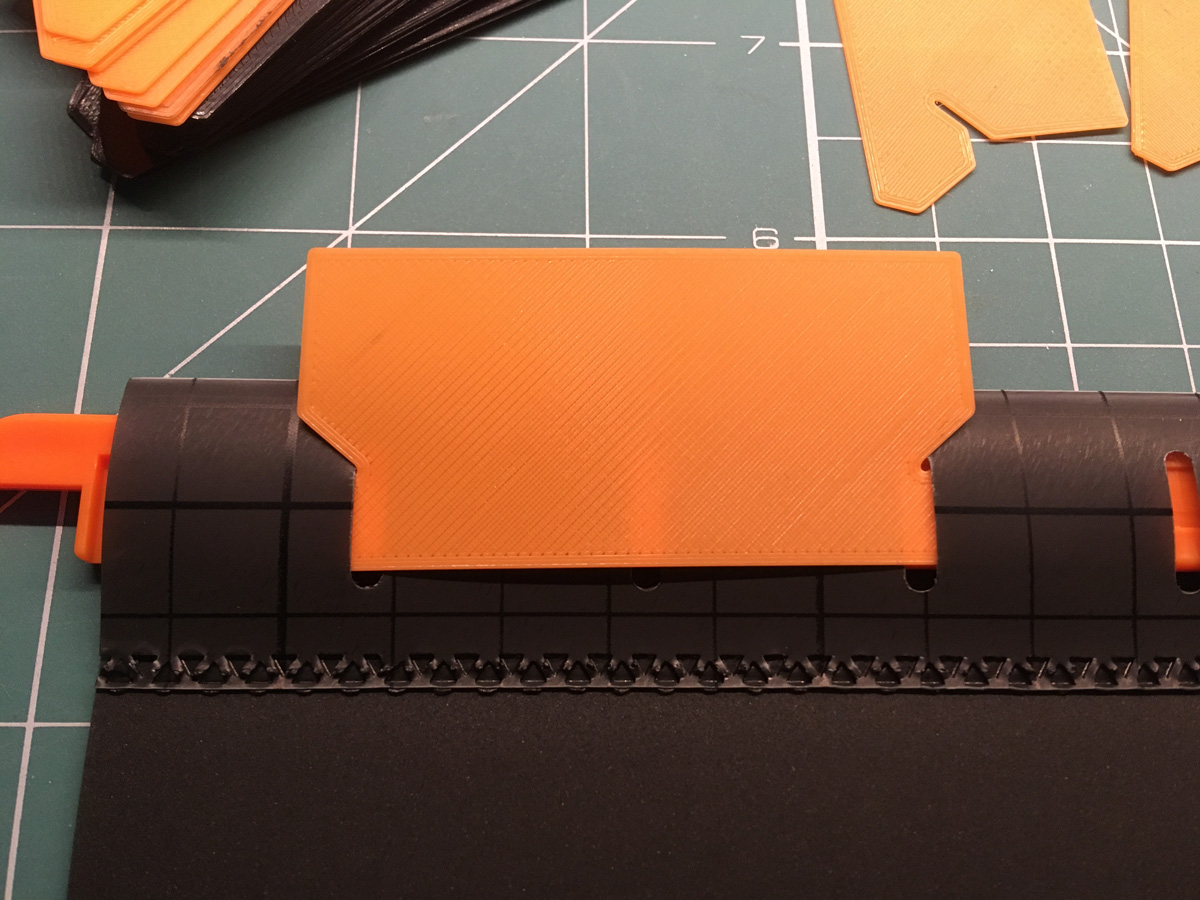
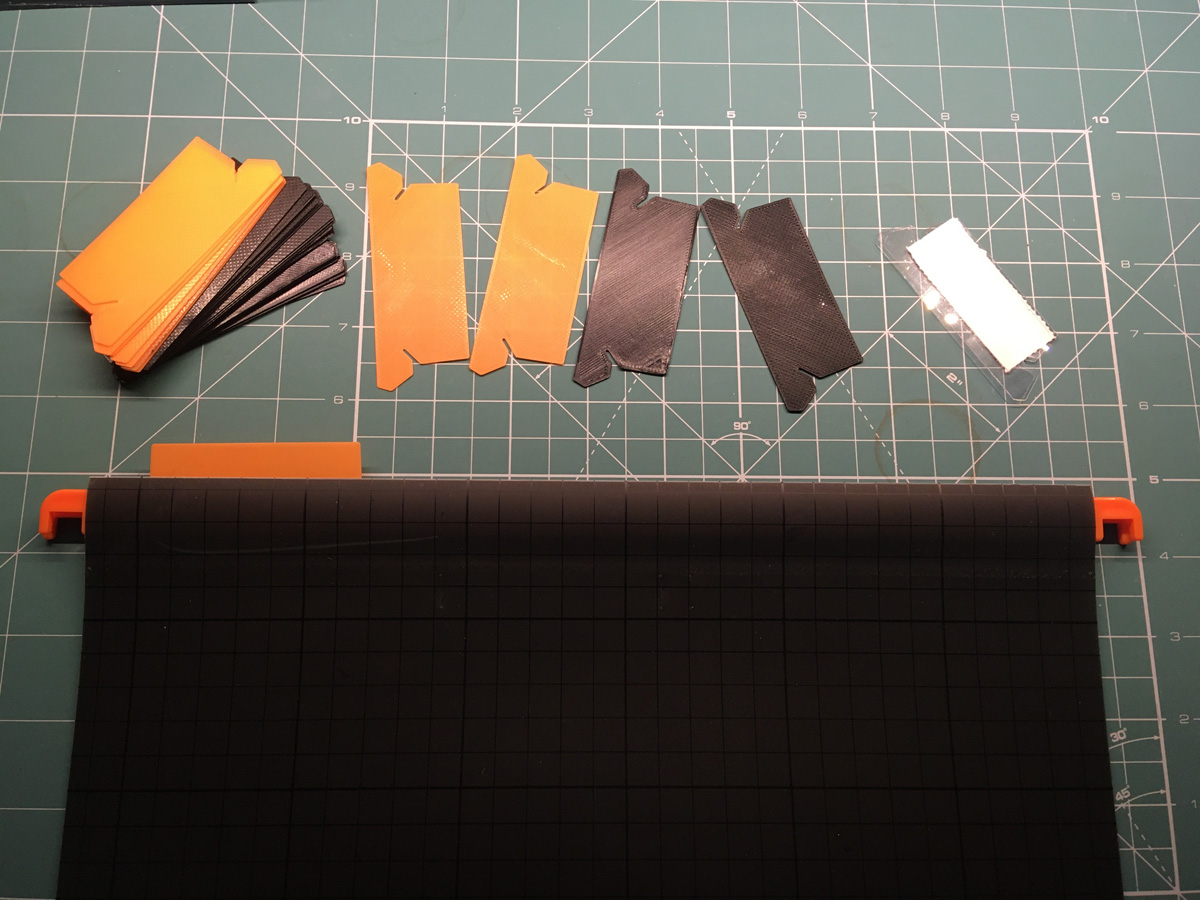
<p>Then printed a bunch of orange and black tabs.  I made these only 0.6mm thick so they’re quite flexible meaning they’re easy to slip into the slots on the drop files:</p>

<p><img src="/content/2021/2021-05-26-drop-file-box-with-3d-printed-rails/IMG_0782.JPG" alt="" class="img-fluid" /></p>

<p><img src="/content/2021/2021-05-26-drop-file-box-with-3d-printed-rails/IMG_0777.JPG" alt="" class="img-fluid" /></p>

<p><img src="/content/2021/2021-05-26-drop-file-box-with-3d-printed-rails/IMG_0779.JPG" alt="" class="img-fluid" /></p>

<p><img src="/content/2021/2021-05-26-drop-file-box-with-3d-printed-rails/IMG_0780.JPG" alt="" class="img-fluid" /></p>

<p>This roll of 1,100 50mm by 20mm self-adhesive labels was <a href="https://www.aliexpress.com/item/4000689639173.html">185 baht on AliExpress</a>:</p>

<p><img src="/content/2021/2021-05-26-drop-file-box-with-3d-printed-rails/IMG_0857.JPG" alt="" class="img-fluid" /></p>

<h1 id="finished-product">Finished Product</h1>

<p>With the rails installed and the files tidied up and labelled, my file access problems are a distant memory and the final result looks great!</p>

<p><img src="/content/2021/2021-05-26-drop-file-box-with-3d-printed-rails/IMG_0860.JPG" alt="" class="img-fluid" /></p>

<p><img src="/content/2021/2021-05-26-drop-file-box-with-3d-printed-rails/IMG_0862.JPG" alt="" class="img-fluid" /></p>

<p>Improvements I’d consider if I was doing this project again would be:</p>

<ul>
  <li>Reduce the number of bolts - it’s currently way overbuilt in terms of load capacity</li>
  <li>Skip the glue - bolts are enough</li>
  <li>Revise the faceplate design to incorporate a cover to hide the bolts for improved aesthetics</li>
  <li>Always use brims when printing long flat thin delicate parts!</li>
  <li>Get a label printer to raise the bar on label quality - I may yet get a label printer and redo all the labels.</li>
</ul>]]></content><author><name></name></author><category term="3dprinting" /><summary type="html"><![CDATA[A while back I had a small under desk Ikea drawer unit with a drawer for Ikea Summera drop files. This was great for a while but eventually the drawer filled up and I decided the drawer unit took up too much floor space, so I moved the files to a plastic tub and sold the drawers on CraigsList.]]></summary></entry><entry><title type="html">Weather Station v1</title><link href="https://brendonmatheson.com/2021/05/23/weather-station-v1.html" rel="alternate" type="text/html" title="Weather Station v1" /><published>2021-05-23T22:33:00+00:00</published><updated>2021-05-23T22:33:00+00:00</updated><id>https://brendonmatheson.com/2021/05/23/weather-station-v1</id><content type="html" xml:base="https://brendonmatheson.com/2021/05/23/weather-station-v1.html"><![CDATA[<p>I need a weather station and this weekend I started building one.  I’ll be working on this on-and-off over the next few months so I figured I’d post progress updates along the way.</p>

<p>Today’s update covers:</p>

<ul>
  <li>Base platform (a Raspberry Pi)</li>
  <li>BME280 sensor integration for barometric pressure, humidity and temperature readings</li>
  <li>Data plane built on MQTT, Telegraf, InfluxDB and Grafana</li>
</ul>

<p>A goal of this project, in addition to building an actual weather station, is to provide my configuration as a reusable artifact upon which others can build their own similar projects.  To that end, my code and documentation are <a href="https://github.com/brendonmatheson/weather-station">on GitHub</a> and licensed under GNU GPLv2.</p>

<h1 id="architecture">Architecture</h1>

<p>My goal state architecture is as follows:</p>

<p><img src="/content/2021/2021-05-23-weather-station-v1/architecture.png" alt="" class="img-fluid" /></p>

<p>In summary</p>

<ul>
  <li>The weather station should have it’s own MQTT broker and local storage so that if network comms are interrupted, measurements are still captured and are buffered to be sent out once comms are restored.</li>
  <li>An on-prem MQTT bus will bridge measurements from the weather station at the edge into the internal network from where they can be fed to other locations</li>
  <li>For now measurements will just be stored in another InfluxDB instance on-prem to feed into Grafana dashboards on my existing telemetry stack alongside other dashboards that are populated from Prometheus such as my <a href="/2020/02/20/monitoring-apc-ups-units-with-prometheus-on-raspberry-pi.html">UPS monitoring dashboard</a>.  Later I may also pipe measurements from that on-prem MQTT broker up to AWS.</li>
</ul>

<p>This weekend I got all the major components on the weather station itself in place and added a dashboard to my Grafana instances to pull metrics directly from the station’s local InfluxDB.</p>

<h1 id="sensors">Sensors</h1>

<p>The full suite of metrics that the station will eventually monitor are:</p>

<ul>
  <li>Wind Speed (Misol anemometer)</li>
  <li>Wind Direction (Misol wind vane)</li>
  <li>Temperature (BME280 sensor)</li>
  <li>Humidity (BME280 sensor)</li>
  <li>Barometric Pressure (BME280 sensor)</li>
  <li>Air Quality (TGS2600 sensor)</li>
  <li>PM 2.5 (PMS5003 sensor)</li>
  <li>Sunlight (visible, UV-A, UV-B via a GY1145 sensor)</li>
  <li>Lightning Strikes (AS3935 sensor)</li>
  <li>Rainfall (Misol rain gauge)</li>
  <li>Gasses (MQ-2, MQ-3, etc, etc - around 5 of them)</li>
  <li>Ground Temperature (DS18B20 sensor)</li>
  <li>Ground Moisture (generic capacitive sensor which will probably corrode out in about 3 weeks)</li>
</ul>

<h1 id="v1-build">v1 Build</h1>

<h2 id="hardware">Hardware</h2>

<p>This weekend my focus was getting the base platform bedded down and stable, along with integrating the first sensor.</p>

<p><img src="/content/2021/2021-05-23-weather-station-v1/IMG_0835_edit1.jpg" alt="" class="img-fluid" /></p>

<p>I put it together from the following components that were in my parts cabinet:</p>

<ul>
  <li>Raspberry Pi 3B</li>
  <li>X705  UPS Board with two 18650 lithium batteries installed</li>
  <li>Transcend 128GB M.2 SSD in a USB-C enclosure</li>
  <li>Various metal stand-offs, bolts and nuts</li>
  <li>Hoco brand silicon sleeved short USB-C and micro-USB cables</li>
</ul>

<p>I also 3D printed a bracket to mount the SSD onto stand-off posts to secure it to the platform.</p>

<p>I won’t go through the full build - if you’ve done anything with Raspberry Pi’s there’s nothing complicated here.</p>

<p>The only challenge I encountered was that initially I tried to power the Pi via one of the JST outputs from the UPS board and it was persistently undervolting.  After switching to micro-USB the UPS board seems to provide enough power to drive the Pi with the attached SSD with not a single undervolt event.  I’ve had this UPS board for a while and I don’t recommend it - there are a lot better options available these days.</p>

<p>Even though the UPS board isn’t the best, it does provide the assurance that if the mains power supply fails the station will continue to run for at least a couple of hours (an endurance test is TBD).</p>

<h2 id="sensor">Sensor</h2>

<p>I had to solder the breakout pins onto my BME280 but after that connecting it up was easy thanks to the <a href="https://projects.raspberrypi.org/en/projects/build-your-own-weather-station/2">Raspberry Pi Weather Station project guide</a> which I followed pretty much exactly for this part.</p>

<h2 id="software">Software</h2>

<p>Getting the software up and running took a while mostly because I realized that Influx 2 doesn’t offer an official arm7 Docker image and so went off on an Ubuntu Server 20 64-bit LTS tangent for a while.  In the end I came back to 32-bit Raspberry Pi OS with Influx 1.8 because I found the Ubuntu Server distro really slow on my Pi 3.</p>

<p>I won’t explain every little thing because it’s actually documented in detail in the <a href="https://github.com/brendonmatheson/weather-station/blob/master/README.md">README.md</a> in my GitHub repo, however to summarize the build process:</p>

<ul>
  <li>Setup base OS - in my case this involved enabling SSD boot because I definitely do not want to run my weather station off a SD card</li>
  <li>Setup Docker, Docker Compose, I2C</li>
  <li>Setup few Prometheus exporters so that the weather station host itself can be monitored by my existing telemetry-stack - given that I’m also using Telegraf to ship weather station measurements, I could potentially replace the Prometheus exporters with Telgraf and save some CPU and memory - will consider that</li>
  <li>Clone my weather-station repo</li>
</ul>

<p>Then to start everything up:</p>

<div class="language-bash highlighter-rouge"><div class="highlight"><pre class="highlight"><code><span class="c"># Launch the MQTT broker</span>
<span class="nb">cd </span>mqtt-broker
./start.sh

<span class="c"># Launch the local InfluxDB instance with Telegraf data shipper</span>
<span class="nb">cd</span> ../local-storage
./start.sh

<span class="c"># Launch the Python script to read sensors</span>
<span class="nb">cd</span> ../sensor_loop
python3 main.py
</code></pre></div></div>

<p>Note I’m currently running this from inside a <code class="language-plaintext highlighter-rouge">tmux</code> session so I don’t need to <code class="language-plaintext highlighter-rouge">nohup</code> it.  I will be wrapping the <code class="language-plaintext highlighter-rouge">sensor_loop</code> script in a Docker image soon so that it’s easier to manage as a service.  My sensor_loop script BTW is based off the sample code from the previously mentioned <a href="https://projects.raspberrypi.org/en/projects/build-your-own-weather-station/2">Raspberry Pi Weather Station project guide</a> which is recommended reading if you want to do something like this.</p>

<h2 id="dashboard">Dashboard</h2>

<p>Finally I added my weather station as a datasource in Grafana and created a dashboard.  Naturally I’m practicing infrastructure-as-code so the datasource was defined in my <a href="https://grafana.com/docs/grafana/latest/administration/provisioning/">Grafana provisioning</a> config as follows:</p>

<div class="language-yaml highlighter-rouge"><div class="highlight"><pre class="highlight"><code><span class="na">apiVersion</span><span class="pi">:</span> <span class="m">1</span>

<span class="na">deleteDatasources</span><span class="pi">:</span>
  <span class="pi">-</span> <span class="na">name</span><span class="pi">:</span> <span class="s2">"</span><span class="s">hea92weather01"</span>
    <span class="na">orgId</span><span class="pi">:</span> <span class="m">1</span>

<span class="na">datasources</span><span class="pi">:</span>
  <span class="pi">-</span> <span class="na">name</span><span class="pi">:</span> <span class="s2">"</span><span class="s">hea92weather01"</span>
    <span class="na">type</span><span class="pi">:</span> <span class="s2">"</span><span class="s">influxdb"</span>
    <span class="na">access</span><span class="pi">:</span> <span class="s2">"</span><span class="s">proxy"</span>
    <span class="na">database</span><span class="pi">:</span> <span class="s2">"</span><span class="s">weather"</span>
    <span class="na">user</span><span class="pi">:</span> <span class="s2">"</span><span class="s">grafana"</span>
    <span class="na">password</span><span class="pi">:</span> <span class="s2">"</span><span class="s">password"</span>
    <span class="na">url</span><span class="pi">:</span> <span class="s2">"</span><span class="s">http://10.80.2.31:8086"</span>
</code></pre></div></div>

<p>I created the dashboard through the Grafana UI but then exported it into my Grafana git repo so it can also be provisioned on launch.  The dashboard, which is not that exciting yet, looks like ths:</p>

<p><img src="/content/2021/2021-05-23-weather-station-v1/dashboard.png" alt="" class="img-fluid" /></p>

<p>The saw-tooth nature of the temperature and humidity readings is because the station is sitting in my home office and so it’s showing the fluctuations as the air conditioner turns on and off.  It’s amazing how immediate the temperature change is when you can observe it in tenths of a degree as the BME280 offers.</p>

<p>I also found it interesting that the BME280 is reading the air pressure as anywhere from 1001 to 1005 milli-bars - this is plausible since much of Bangkok is actually below sea-level!  Although where I am is about 15 meters above sea-level.</p>

<h1 id="next-steps">Next Steps</h1>

<p>The next things to do are:</p>

<ul>
  <li>Tuning and improvements on the edge InfluxDB including tuning retention window settings to keep as much data as possible without exhausting the SSD capacity.</li>
  <li>Setup the MQTT bridge to get data off the station and into my main network where it can be further routed.</li>
  <li>Setup the on-prem InfluxDB instances to accumulate the data.</li>
  <li>Update my Grafana config to use the on-prem InfluxDB’s instead of the edge InfluxDB.</li>
  <li>Add the next sensor which will probably be the lightning sensor since I have one in my parts box, it’s also I2C so should be easy, and we’re just entering rainy season in Bangkok and there’s a lot of lightning to detect!</li>
</ul>]]></content><author><name></name></author><category term="observability" /><category term="farming" /><category term="iot" /><category term="weather_station" /><summary type="html"><![CDATA[I need a weather station and this weekend I started building one. I’ll be working on this on-and-off over the next few months so I figured I’d post progress updates along the way.]]></summary></entry></feed>