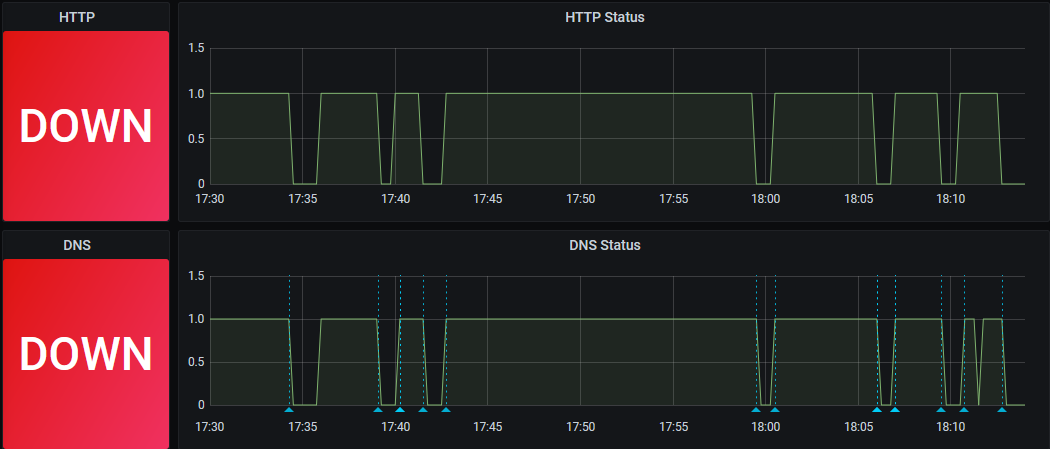
Instability on my residential Internet connection this week prompted me to add some blackbox_exporter probes to my Prometheus/Grafana monitoring system so I could collect outage data to share with my ISP.

That issue is resolved now but along the way I decided to figure out how to add performance measurements from speedtest.net onto my networking dashboard to improve my understanding of my networks health. I ended up customizing an existing open-source exporter so that I could get measurements from multiple targets. You can get that customized version from my fork on GitHub. Read on to see how it works:
Basic Setup
Ookla offers a single-binary CLI in various architectures for speedtest.net including Arm (Raspberry Pi friendly). A number of people have wrapped this as a Prometheus exporter and after reading through a few I ended up going with this one from GitHub user billimek.
This solution is built in turn on script_exporter which lets you create blackbox_exporter style exporters that have a /probe and a /metrics endpoint, which makes sense for Speedtest since you don’t want to be running actual tests constantly.
There is a build available on Docker Hub but I wanted to build from source. billimek has provided a nice multi-arch build script based on buildx that pulls down the architecture-appropriate version of script_exporter and bundles it with a wrapper script that calls the speedtest CLI and exports the metrics out of it. My monitoring system runs on a Raspberry Pi 4 running Docker 19.03 which is supposed to support buildx but I just could not get it to work so I ended up just capturing the build command generated by the build script and de-buildx’ing it to:
sudo docker build \
    --file Dockerfile \
    --platform linux/arm/v7 \
    --label=built-by=billimek \
    --label=build-type=manual \
    --label=built-on=bkkcontrol01 \
    --tag billimek/prometheus-speedtest-exporter:latest .
Once built it’s easy to test by running it:
sudo docker run --rm -it -p 9469:9469 billimek/prometheus-speedtest-exporter:latest
And hitting the /probe endpoint:
curl http://localhost:9469/probe?script=speedtest
After about 30 seconds:
# HELP script_success Script exit status (0 = error, 1 = success).
# TYPE script_success gauge
script_success{} 1
# HELP script_duration_seconds Script execution time, in seconds.
# TYPE script_duration_seconds gauge
script_duration_seconds{} 99.714076
# HELP speedtest_latency_seconds Latency
# TYPE speedtest_latency_seconds gauge
speedtest_latency_seconds 17.363
# HELP speedtest_jittter_seconds Jitter
# TYPE speedtest_jittter_seconds gauge
speedtest_jittter_seconds 1.023
# HELP speedtest_download_bytes Download Speed
# TYPE speedtest_download_bytes gauge
speedtest_download_bytes 5852661
# HELP speedtest_upload_bytes Upload Speed
# TYPE speedtest_upload_bytes gauge
speedtest_upload_bytes 2433723
# HELP speedtest_downloadedbytes_bytes Downloaded Bytes
# TYPE speedtest_downloadedbytes_bytes gauge
speedtest_downloadedbytes_bytes 43619764
# HELP speedtest_uploadedbytes_bytes Uploaded Bytes
# TYPE speedtest_uploadedbytes_bytes gauge
speedtest_uploadedbytes_bytes 23199680
script_exporter allows you to package multiple scripts and the ?script=speedtest is how you tell script_exporter which one you want to run. In the Prometheus context this is specified as a params key:
  - job_name: "speedtest"
    metrics_path: /probe
    params:
      script: [speedtest]
    static_configs:
      - targets:
        - 10.80.2.9:9469
    scrape_interval: 60m
    scrape_timeout: 10m
After successfully testing it I also added the speedtest exporter to my docker-compose.yaml that defines my whole monitoring solution
  #
  # Speed Test Exporter
  #

  speedtest:
    image: "billimek/prometheus-speedtest-exporter:latest"
    restart: "on-failure"
    ports:
      - 9469:9469
And made a quick dashboard:

Testing Against Multiple Servers
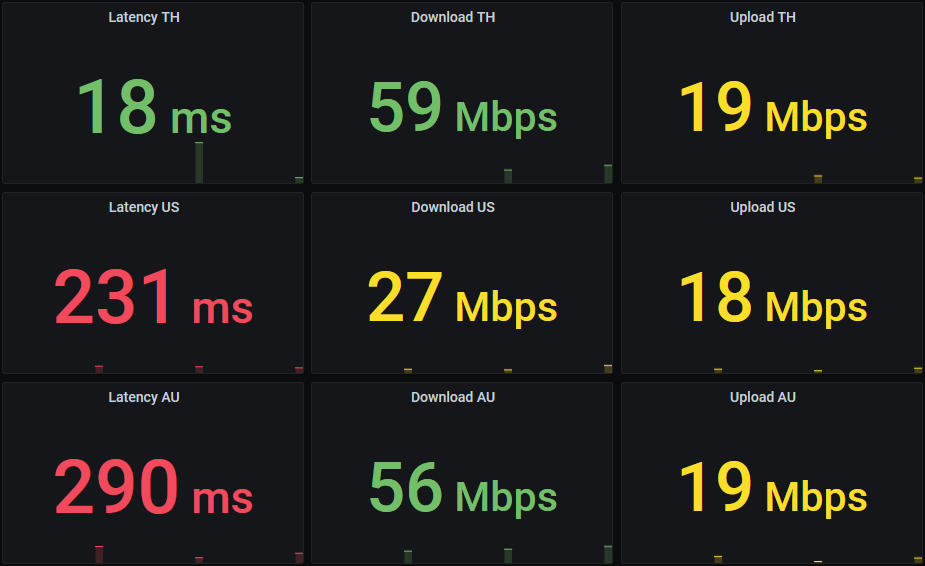
Here’s the thing - I live in Thailand and these speedtest measurements are from hitting a server somewhere here in Bangkok. But the reality is 99.9% of our Internet traffic is to hosts outside Thailand so I wanted to get measurements from somewhere in US West, somewhere in Australia and maybe other locations for a more realistic view of the network performance.
When you run the speedtest CLI it automatically chooses a server close to you by default, but it also has a --server-id option so you can specify exactly which server you want to test against. Using this nice searchable list I identified that I wanted to hit the following servers:
- 3855 => DTAC Bangkok
- 1782 => Comcast Seattle
- 2225 => Telstra Melbourne
Now we don’t want to run separate exporters for each server because there’s a chance they run at the same time and interfere with each other. What we want is to run a single exporter which takes a list of servers of interest and speedtests them in series for each /probe invocation.
script_exporter is supposed to be able to take query string parameters and pass them through unadulterated to the script, but in my experimentation this did not seem to work and in the interests of time I fell back to setting the list as an environment variable on the Docker container:
  #
  # Speed Test Exporter
  #

  speedtest:
    image: "billimek/prometheus-speedtest-exporter:latest"
    restart: "on-failure"
    ports:
      - 9469:9469
    environment:
      - server_ids=3855,1782,2225 # 3855 => DTAC Bangkok; 1782 => Comcast Seattle; 2225 => Telstra Melbourne
Then modified the script to split that list into an array and run speedtest for each entry:
IFS=',' read -ra server_id_array <<< "$server_ids"
for server_id in "${server_id_array[@]}"
do
    # Original speedtest_exporter script code here
done
Also added the server ID as a label on the metrics so that the output is now something like this:
speedtest_latency_seconds{server_id="3855"} 17.363
speedtest_jittter_seconds{server_id="3855"} 1.023
speedtest_download_bytes{server_id="3855"} 5852661
speedtest_upload_bytes{server_id="3855"} 2433723
speedtest_downloadedbytes_bytes{server_id="3855"} 43619764
speedtest_uploadedbytes_bytes{server_id="3855"} 23199680
speedtest_latency_seconds{server_id="1782"} 251.393
speedtest_jittter_seconds{server_id="1782"} 8.062
speedtest_download_bytes{server_id="1782"} 5282354
speedtest_upload_bytes{server_id="1782"} 1200136
speedtest_downloadedbytes_bytes{server_id="1782"} 51102720
speedtest_uploadedbytes_bytes{server_id="1782"} 9570976
speedtest_latency_seconds{server_id="2225"} 292.73
speedtest_jittter_seconds{server_id="2225"} 2.663
speedtest_download_bytes{server_id="2225"} 530024
speedtest_upload_bytes{server_id="2225"} 681875
speedtest_downloadedbytes_bytes{server_id="2225"} 5343840
speedtest_uploadedbytes_bytes{server_id="2225"} 9387328
Get the full updated code from my fork.
So finally my dashboard now shows in near real-time just how terrible my connectivity to the outside world really is:
