The snmp_exporter is one of the trickier Prometheus components to set up because there’s a few moving parts involved in a full configuration and because of the need to run an extra tool to generate the snmp.yml config file from the ever-mysterious “MIBS”.
I recently got Prometheus to talk to my pfSense router and since I couldn’t find any good step-by-step guides when I was doing this, I thought I’d write up what I did.
Goal State
The goal is to be able to visualize traffic flowing through the router in a Grafana dashboard. I find this type of view useful for at-a-glance understanding of the state of my network:
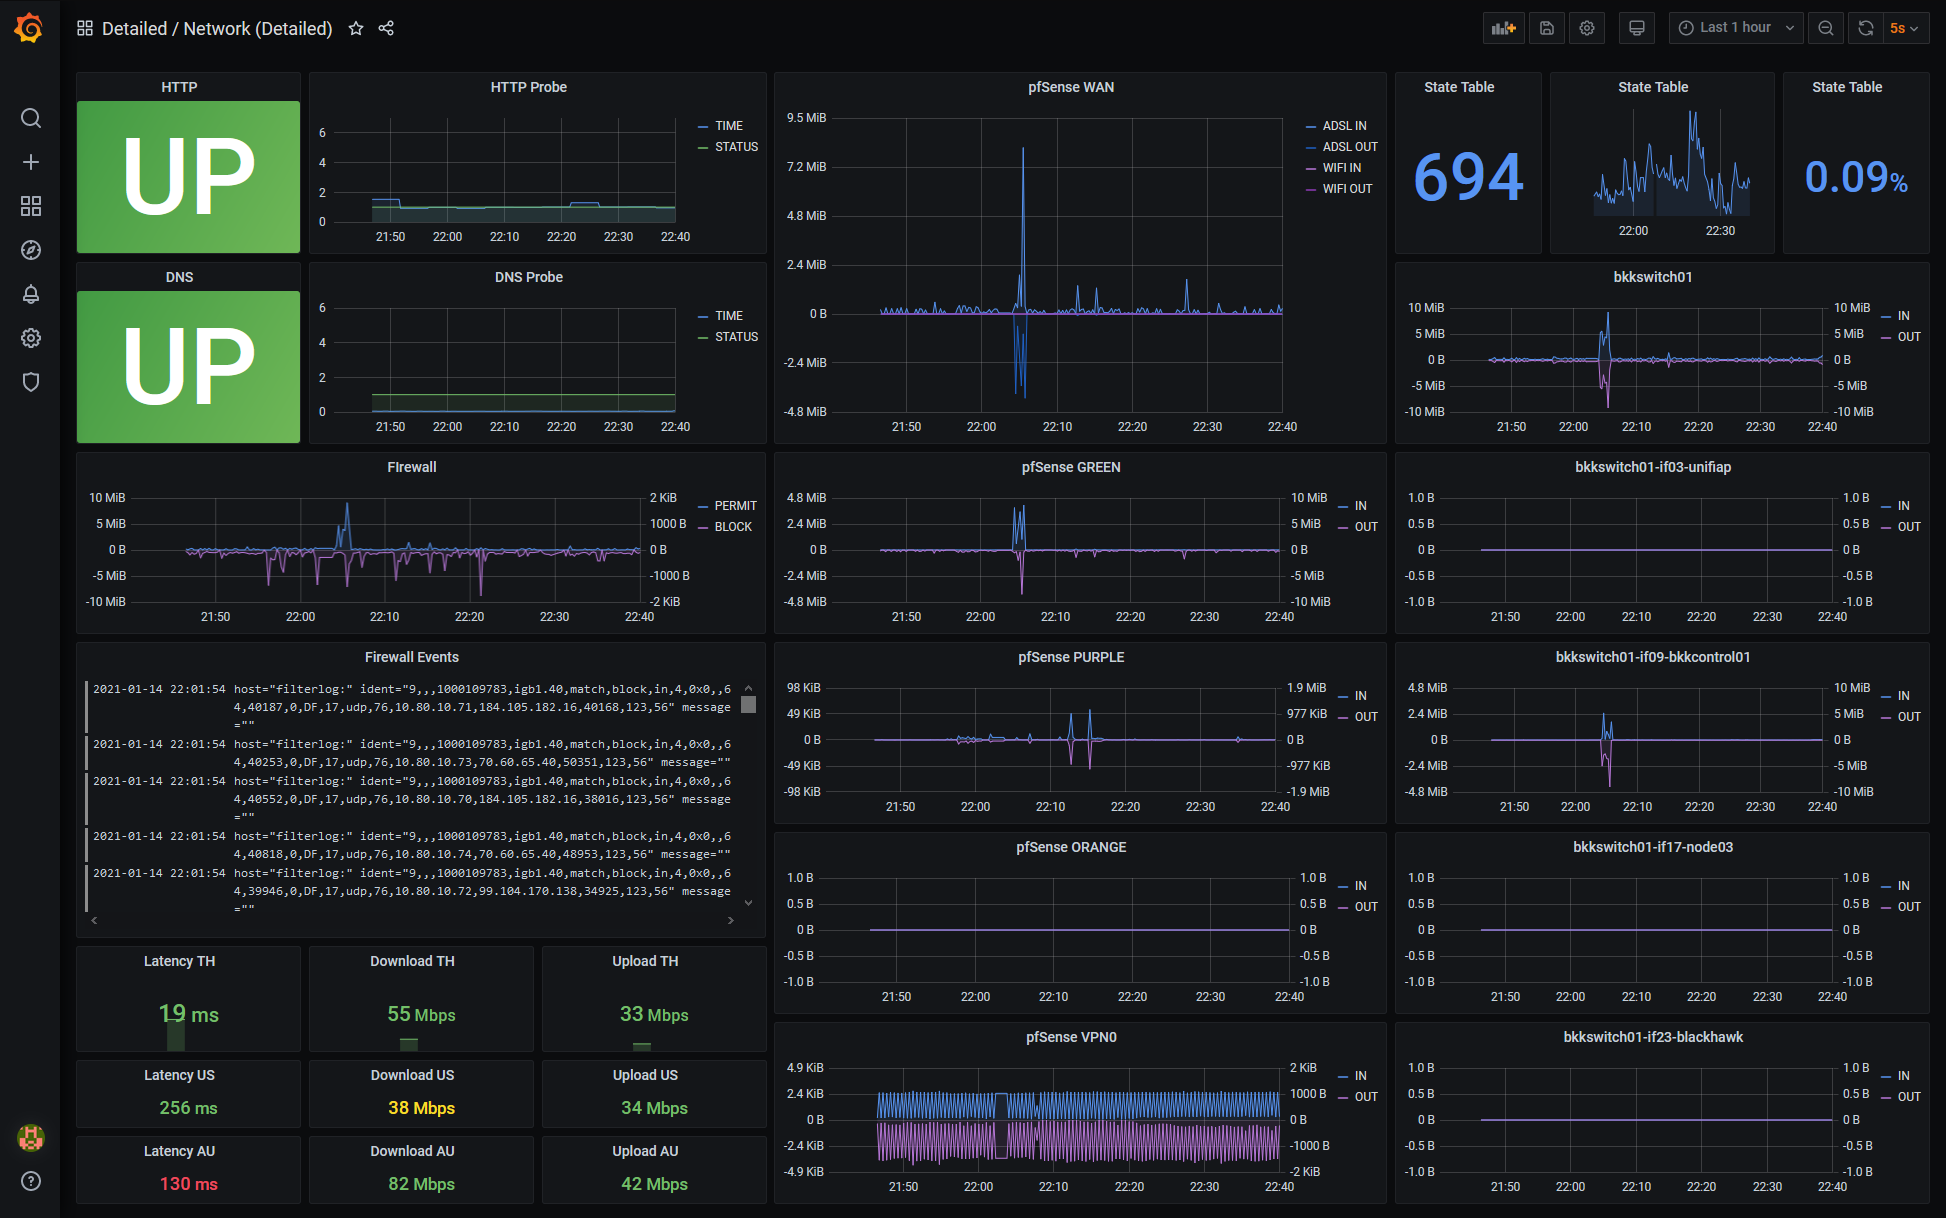
Note that in addition to the network activity graphs we’ll be creating using SNMP, at the lower-left corner you can see speedtest.net results which I’ve blogged about previously, and above that firewall events obtained via syslogd + fluentd + Loki which I’ll write up some other time.
To achieve this we need Prometheus to pull metrics from pfSense via SNMP, and then to visualize some of those metrics in Grafana:
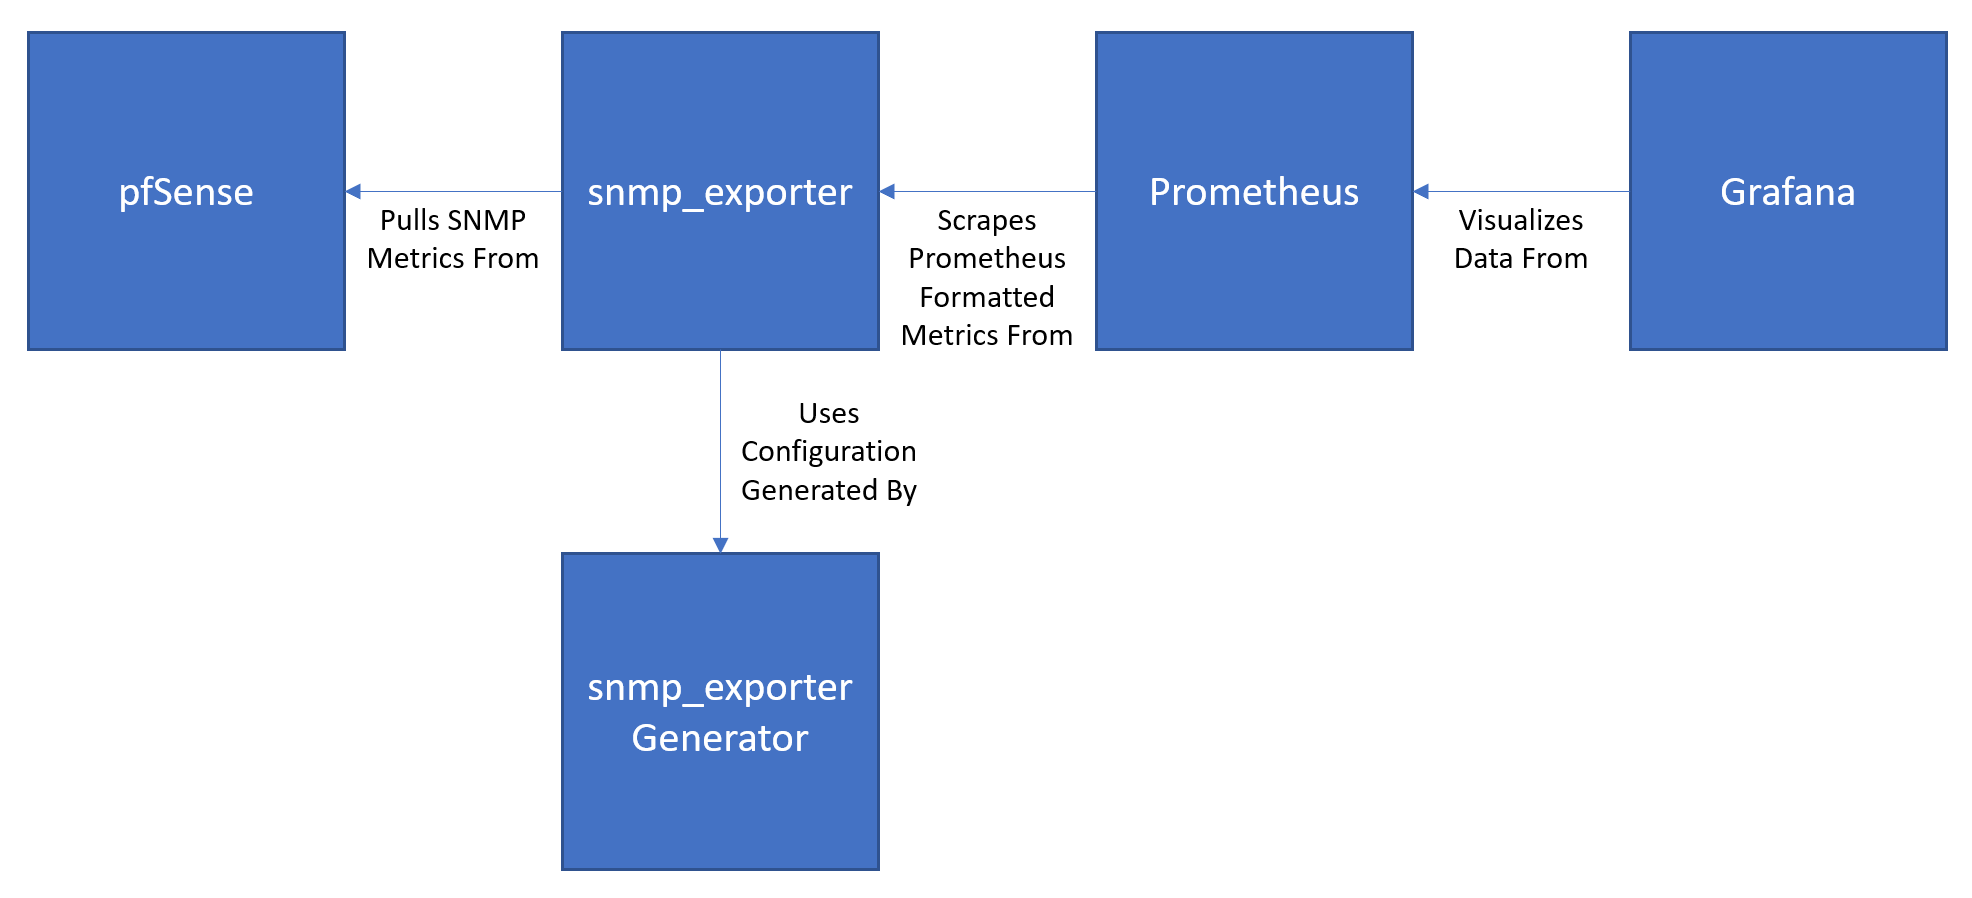
So the moving parts involved are:
- Grafana - which visualizes data from
- Prometheus - which scrapes metrics from
- snmp_exporter - which uses a config generated by
- snmp_exporter Generator - to talk to
- pfSense Router
We’re going to work from left-to-right to get each component setup and tested before we move to the next.
Environment
I’m going to assume that you have the following hosts:
- pfSense router
- Monitoring Host - running Prometheus and Grafana
- Linux Workstation
For some steps in this procedure we’re going to install additional tools on the Linux Workstation (snmp, make, etc). You can feel free to do those steps directly on your Monitoring Host instead if you don’t have a separate Linux Workstation and don’t mind having those extra tools deployed there.
Background Study
Before you begin you might care to watch this in-depth presentation from Netgate on pfSense’s SNMP support:
- Video - https://www.youtube.com/watch?v=CKPbIeiJ2AQ
- Slides - https://www.slideshare.net/NetgateUSA/monitoring-pfsense-24-with-snmp-pfsense-hangout-march-2018
You should also familiarize yourself with MIB files, although you don’t need to be able to read them to complete this guide.
SNMP Version Caveat
I’m currently using SNMPv1 for two reasons:
- It’s easy to get started because the authentication mechanism is a simple shared secret (which is sent in the clear BTW)
- The SNMP daemon that is bundled with pfSense (bsnmpd) only supports SNMPv1 and SNMPv2. To use v3 you need to use the optional add-on package for NET-SNMP
SNMPv1 is not secure so the configuration documented here is not appropriate for an enterprise situation - or even really for a homelab - but its a starting point. Now that I have the configuration working end-to-end my next project will be to switch everything to SNMPv3. Once I have that working I’ll do an update post.
pfSense Router
Overview
In pfSense we need to do three things:
- Enable SNMP
- Retrieve the MIB files for use with the generator in the next stage
- Test SNMP access
Enable SNMP
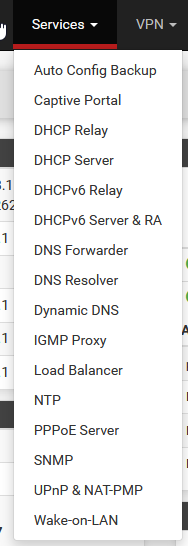
As noted above for now we’re using the bundled bsnmpd service. To activate it, in the pfSense console navigate to Services / SNMP:
Enable the service and set the community string to some long and random string - this is effectively your password and even though SNMPv1 transmits it in the clear we should at least make it as hard as possible to guess. Leave the port as 161 and enable all modules except Regex - this is as recommended in the Netgate Hangout video linked above:
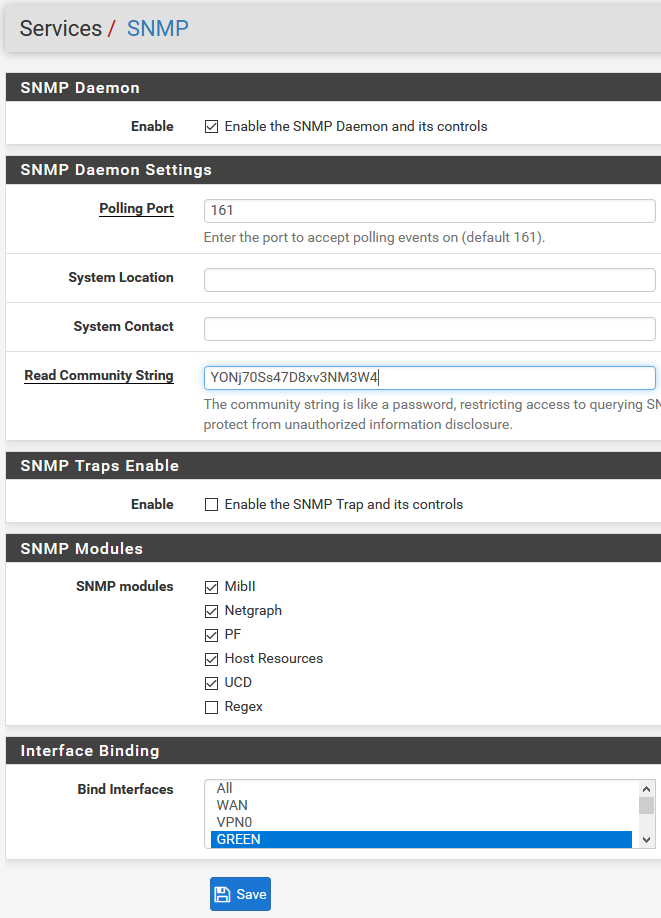
Also at this step we choose which interfaces we want SNMP to bind to. In my case I only want to access it from my internal LAN (named GREEN) so that is the only interface I’ve bound.
Finally we need to make sure that UDP port 161 is not filtered on the interface that we’ve bound. Here I’ve added a permit rule to my GREEN interface to allow requests to port 161 from anywhere else on my GREEN network. For additional security this could be scoped down to only my Monitoring Host:

Make sure this is configured for UDP not TCP.
Retrieve MIB Files
MIB files provide human readible definitions and other meta data to annotate the raw OID’s that identify metrics served by SNMP. Technically you don’t need these, but practically it’s preferrable to working with raw OID’s.
Your pfSense router has the MIB files stored in it’s file system. You just need to SCP them from /usr/share/snmp/mibs.
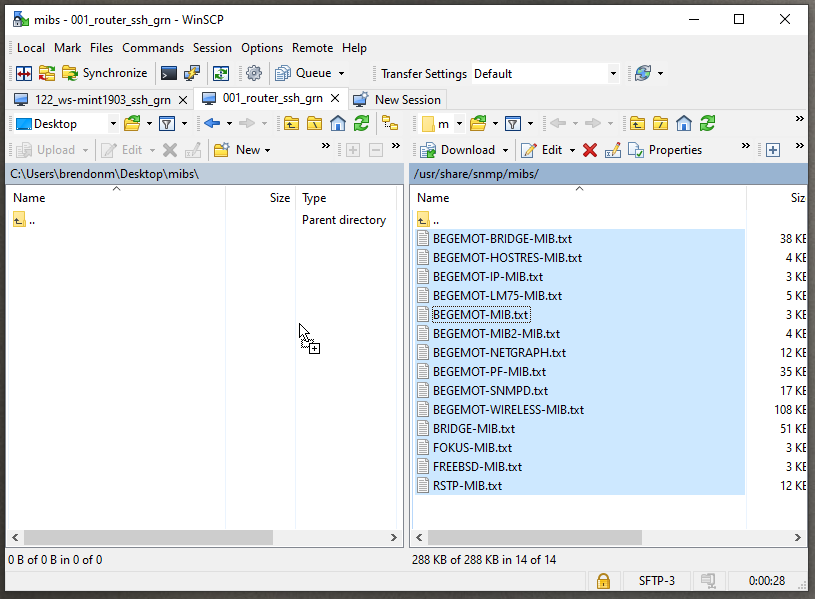
Configuring SSH access so you can SCP those files is beyond the scope of this post but it’s easy to setup - refer to the pfSense documentation for details - and make sure you use keypairs not passwords!
Test SNMP Access
Before we go on to the next stage lets make sure that we can connect to the SNMP service on pfSense and pull data from it. To do this we’re going to use the tool snmpwalk.
if you don’t already have it, install the snmp package on your Linux Workstation:
sudo apt update && sudo apt install -y snmp
Now invoke snmpwalk to check that we can connect to the SNMP service on pfSense:
# General form
snmpwalk -v <snmp-version> -c <community-string> <pfsense-ip-address>

# Example
snmpwalk -v 1 -c YONj70Ss47D8xv3NM3W4 10.80.2.1
You should almost immediately see a long dump of all available metrics:
iso.3.6.1.2.1.1.1.0 = STRING: "pfSense router.yourdomain.com 2.4.5-RELEASE-p1 pfSense FreeBSD 11.3-STABLE amd64"
iso.3.6.1.2.1.1.2.0 = OID: iso.3.6.1.4.1.12325.1.1.2.1.1
iso.3.6.1.2.1.1.3.0 = Timeticks: (1252434) 3:28:44.34
iso.3.6.1.2.1.1.4.0 = ""
iso.3.6.1.2.1.1.5.0 = STRING: "router.yourdomain.com"
iso.3.6.1.2.1.1.6.0 = ""
iso.3.6.1.2.1.1.7.0 = INTEGER: 76
iso.3.6.1.2.1.1.8.0 = Timeticks: (5) 0:00:00.05
iso.3.6.1.2.1.1.9.1.2.1 = OID: iso.3.6.1.4.1.12325.1.1.1.10.2
iso.3.6.1.2.1.1.9.1.2.2 = OID: iso.3.6.1.4.1.12325.1.1.1.10.3
iso.3.6.1.2.1.1.9.1.2.3 = OID: iso.3.6.1.6.3.1
iso.3.6.1.2.1.1.9.1.2.4 = OID: iso.3.6.1.4.1.12325.1.1
iso.3.6.1.2.1.1.9.1.2.5 = OID: iso.3.6.1.2.1.31
iso.3.6.1.2.1.1.9.1.2.6 = OID: iso.3.6.1.2.1.48
...
iso.3.6.1.2.1.2.2.1.2.1 = STRING: "igb0"
iso.3.6.1.2.1.2.2.1.2.2 = STRING: "igb1"
iso.3.6.1.2.1.2.2.1.2.3 = STRING: "igb2"
iso.3.6.1.2.1.2.2.1.2.4 = STRING: "igb3"
iso.3.6.1.2.1.2.2.1.2.5 = STRING: "igb4"
iso.3.6.1.2.1.2.2.1.2.6 = STRING: "igb5"
iso.3.6.1.2.1.2.2.1.2.7 = STRING: "lo0"
...
Etc.
This output is showing the raw OID dotted numbers - at this point we could install the MIB files so we can see the mapped metric names but it’s a frustrating job to get that working and we’ve established connectivity so it’s fine to move on.
If you don’t get a successful result here, go back and check your SNMP configuration in pfSense. Also make sure that UDP port 161 is not firewalled off. You must get the snmpwalk connectivity test working before proceeding.
Another basic test you can do from your Linux Workstation is to probe the SNMP port with nmap:
# Make sure nmap is installed
$ sudo apt install nmap

# Scan port UDP port 161.  Must be superuser when scanning UDP ports so this requires sudo
$ sudo nmap -sU -p 161 10.80.2.1
Starting Nmap 7.70 ( https://nmap.org ) at 2020-09-05 08:50 BST
Nmap scan report for 10.80.2.1
Host is up (0.00029s latency).

PORT    STATE         SERVICE
161/udp open|filtered snmp
References
snmp_exporter Generator
This section builds on the generator docs provided on the GitHub. There is no pre-built binary release of the generator but there is a Dockerized build procedure so it’s very easy.
First on your Linux Workstation get the snmp_generator sources:
git clone https://github.com/prometheus/snmp_exporter.git
cd snmp_exporter
git checkout v0.18.0
Now prepare the base set of MIB files:
cd generator
sudo apt update && sudo apt install -y make
make mibs
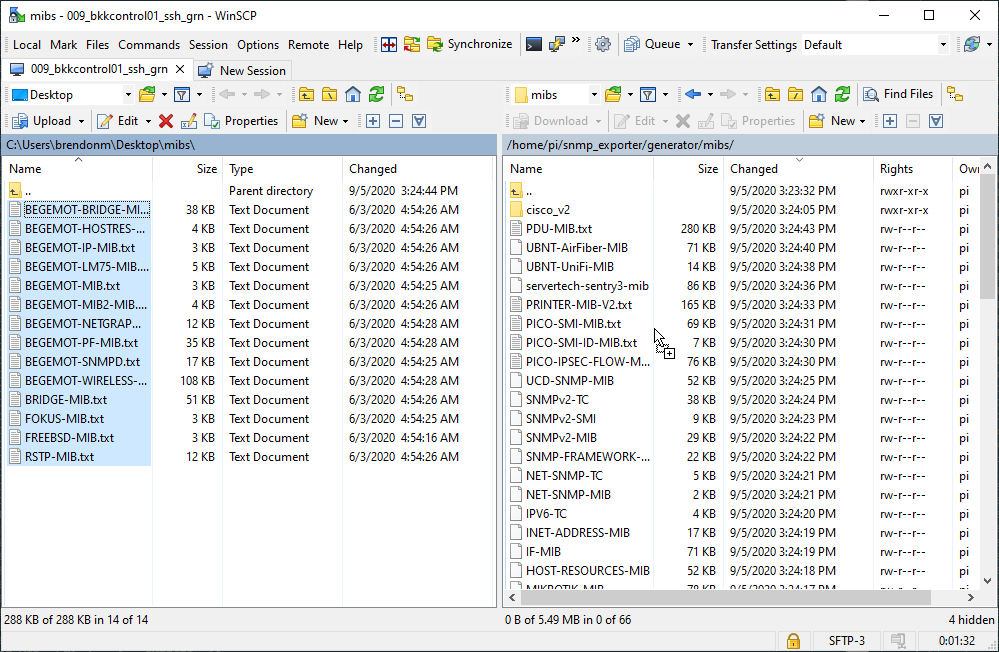
The make mibs command will retrieve a set of MIB files for popular devices. pfSense routers are not included so once make mibs is done, SCP or otherwise copy the pfSense MIB files that you retrieved into snmp_exporter/generator/mibs :
Now we can give the generator a test run using the default generator.yml file that was provided in the GitHub sources:
sudo docker build -t snmp-generator .

sudo docker run --rm -ti \
  -v "${PWD}:/opt/" \
  snmp-generator generate
To elaborate on this docker run command - we are mounting the current directory (i.e. snmp_exporter/generator) at /opt in the container so that the generator can pick up our mibs/ sub-directory, read generator.yml and write us a new snmp.yml in that directory. Check the output to verify that this test run succeeded:
$ ls -l
total 268
...
-rw-r--r-- 1 root root 138664 Sep  5 09:33 snmp.yml
...
Even using the MIB files it’s difficult to know which keys to include and which to skip. Some vendors (e.g Synology) provide a guide doc to help you understand the MIB files but there doesn’t seem to be one for pfSense so we’re left with reading through the MIB files themselves to figure out which keys we should walk. For a walkthrough of how to read MIB files using pfSense files as an example jump to 54:31 in the pfSense Hangout video.
From reading through the BEGEMOT-PF-MIB.txt MIB file I settled on the following keys:
- pfStatus
- pfStateTable
- pfInterfaces
Also for basic network interface info (name, octets in and out, etc) I selected the ifEntry object from the interfaces MIB. My complete generator.yml entry therefore is:
# pfSense

  pfsense:
    walk:
      - ifEntry
      - pfStatus
      - pfStateTable
      - pfInterfaces
    auth:
      community: YONj70Ss47D8xv3NM3W4
Refer to the snmp_exporter documentation to understand the schema of generator.yml.
With the pfsense entry added to generator.yml, re-run the generator:
sudo docker run --rm -ti \
  -v "${PWD}:/opt/" \
  snmp-generator generate
Your new snmp.yml file now includes the keys for pfSense.
Note that I have included ifEntry for interface name and octets in/out. In fact the pfSense MIB defines these also under different names, however the ifEntry version is easier to understand so I’m going with that for now. However in case you want to dive deeper on the pfSense octet metrics here’s what I’ve found so far:
- The interface references are different - for my router what ifEntry calls interface 14, pfSense calls interface 7:
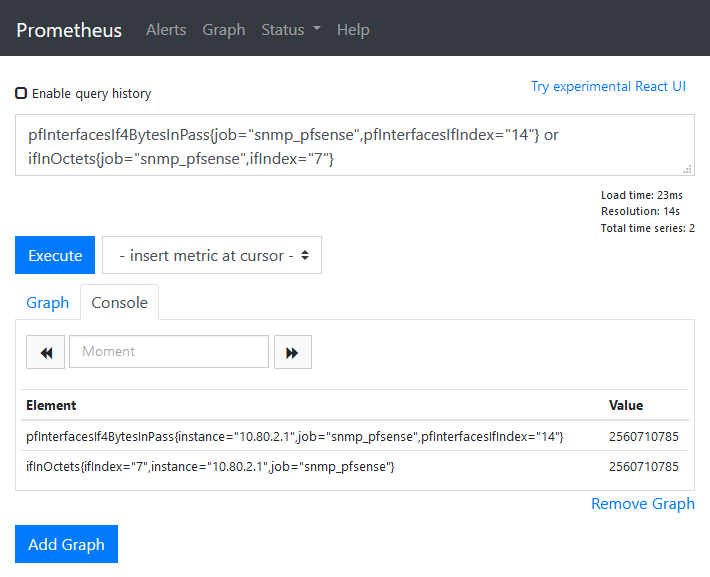
- The pfSense interface names are hex encoded whereas the ifEntry names are plain text:
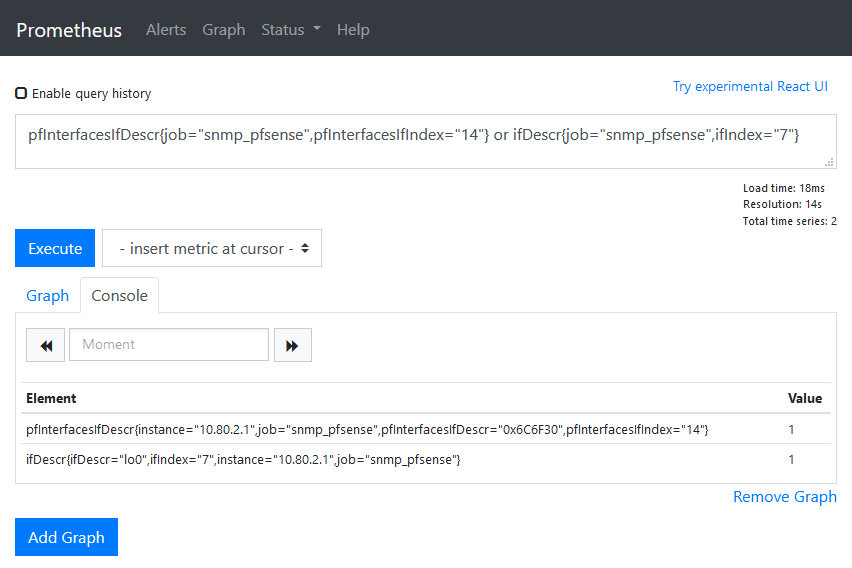
0x6C6F330 is “lo0” in ASCII. When I have time I’ll dive deeper on this but for now I’m going with the ifEntry data because it’s easier to read.
snmp_exporter
Introduction
Now that we have our snmp.yml configuration file, we’re ready to run snmp_exporter. You can deploy snmp_exporter as a raw binary, or via Docker. Since it’s a single statically linked golang binary, both options are pretty much equally convenient.
Deploying via Raw Binary
If you want to run the exporter as a raw binary:
- Place the snmp.yml file from the generator at
/etc/snmp_exporter/snmp.yml. - Grab the binary from the GitHub releases page
- Run
./snmp_exporter
Deploying via Docker
To run the exporter using the official Docker image:
- Place the snmp.yml file from the generator somewhere where it can be mounted by Docker - .e.g
/containers/monitoring/snmp.yml. - Run the container directly with the generated snmp.yml file mounted into the correct location:
sudo docker run --rm -it -p 9116:9116 -v /containers/monitoring/snmp.yml:/etc/snmp_exporter/snmp.yml snmp_exporter:0.18.0
- If you want to run the exporter as a service that launches on host boot using plain Docker (not Compose) then you can use the
-dand--restartswitches as follows:
sudo docker run -d --restart always -p 9116:9116 -v /containers/monitoring/snmp.yml:/etc/snmp_exporter/snmp.yml snmp_exporter:0.18.0
Deploying via Docker Compose
My monitoring stack runs under Docker Compose so in my case I just added another service to run the snmp_exporter:
version: "3"
services:

    ...

    snmp:
        image: "prom/snmp-exporter:v0.18.0"
        restart: "always"
        ports:
          - 9116:9116
        volumes:
          - /containers/monitoring/snmp.yml:/etc/snmp_exporter/snmp.yml
Test SNMP Exporter
Before moving onto the next step we need to make sure the exporter is running and is able to correctly serve metrics that it has pulled from pfSense. The easiest way to do this is to just curl it:
# curl http://MONITORING_HOST_IP:9116/snmp?module=pfsense\&target=PFSENSE_IP_ADDRESS

# For example:
curl http://10.80.2.9:9116/snmp?module=pfsense\&target=10.80.2.1
Results:
# HELP pfCounterBadOffset Number of packets with bad offset. - 1.3.6.1.4.1.12325.1.200.1.2.2
# TYPE pfCounterBadOffset counter
pfCounterBadOffset 0
# HELP pfCounterFragment Number of fragmented packets. - 1.3.6.1.4.1.12325.1.200.1.2.3
# TYPE pfCounterFragment counter
pfCounterFragment 582
...
pfInterfacesIf4BytesInBlock{pfInterfacesIfIndex="15"} 2807
pfInterfacesIf4BytesInBlock{pfInterfacesIfIndex="16"} 0
...
pfInterfacesIf4BytesInBlock{pfInterfacesIfIndex="3"} 0
pfInterfacesIf4BytesInBlock{pfInterfacesIfIndex="4"} 980582
pfInterfacesIf4BytesInBlock{pfInterfacesIfIndex="5"} 7.437175e+06
pfInterfacesIf4BytesInBlock{pfInterfacesIfIndex="6"} 2.7909289e+07
...
# HELP pfInterfacesIf4BytesInPass The number of IPv4 bytes passed coming in on this interface. - 1.3.6.1.4.1.12325.1.200.1.8.2.1.7
# TYPE pfInterfacesIf4BytesInPass counter
...
pfInterfacesIf4BytesInPass{pfInterfacesIfIndex="13"} 1.477300503e+09
pfInterfacesIf4BytesInPass{pfInterfacesIfIndex="14"} 0
pfInterfacesIf4BytesInPass{pfInterfacesIfIndex="15"} 3.9139699e+07
pfInterfacesIf4BytesInPass{pfInterfacesIfIndex="16"} 0
pfInterfacesIf4BytesInPass{pfInterfacesIfIndex="17"} 0
If you get metrics back like this then you can move on to configuring Prometheus, but if you can’t get a response from the exporter or it’s not returning pfSense metrics, then go back and check the previous steps - you must get this working before moving on.
Prometheus
Next we need to tell Prometheus to scrape the SNMP exporter. The job needs to specify the pfsense module, the IP address of the pfSense router as a static target, and a relabel config to replace the address of the monitoring host with the address of the pfSense router in the scraped metrics:
scrape_configs:

    ...

    - job_name: 'snmp_pfsense'
        static_configs:
          - targets:
            - "10.80.2.1"
        metrics_path: "/snmp"
        params:
          module: [pfsense]
        scrape_interval: 10s
        scrape_timeout: 5s
        relabel_configs:
          - source_labels: [__address__]
            target_label: __param_target
          - source_labels: [__param_target]
            target_label: instance
          - target_label: __address__
            replacement: 10.80.2.9:9116  # The SNMP exporter's real hostname:port.
After adding the new job restart Prometheus and give it a few minutes to warm up and scrape some SNMP metrics. Then to verify it’s working open the Prometheus console from http://MONITORING_HOST_IP:9090 and query for the ifDescr metric:
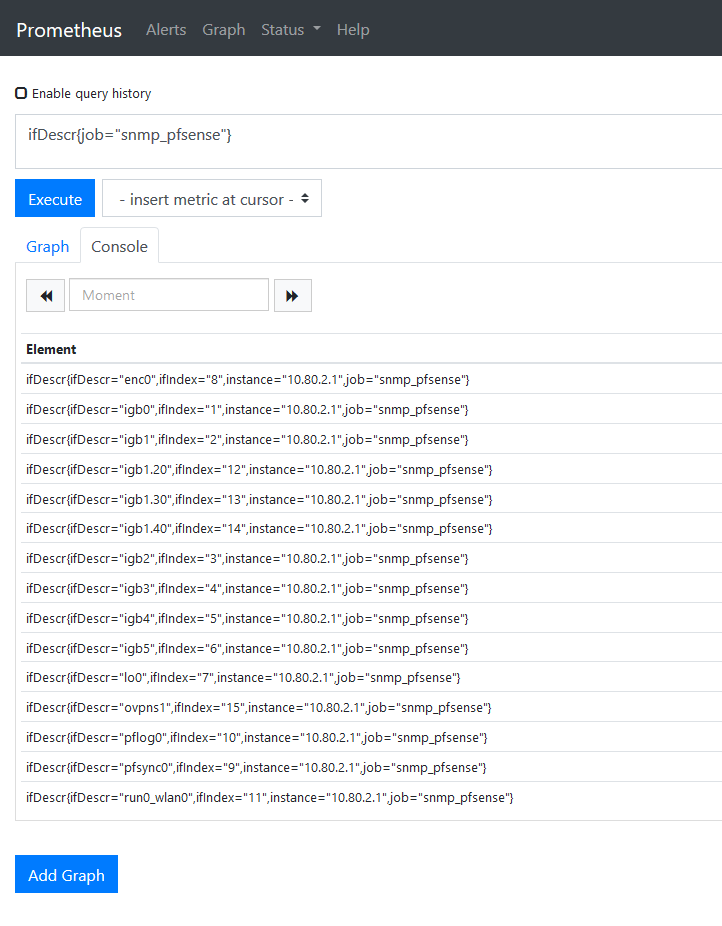
If this test doesn’t work then go back and check that the snmp_exporter is running with the curl command and review the scrape job.
Grafana
Introduction
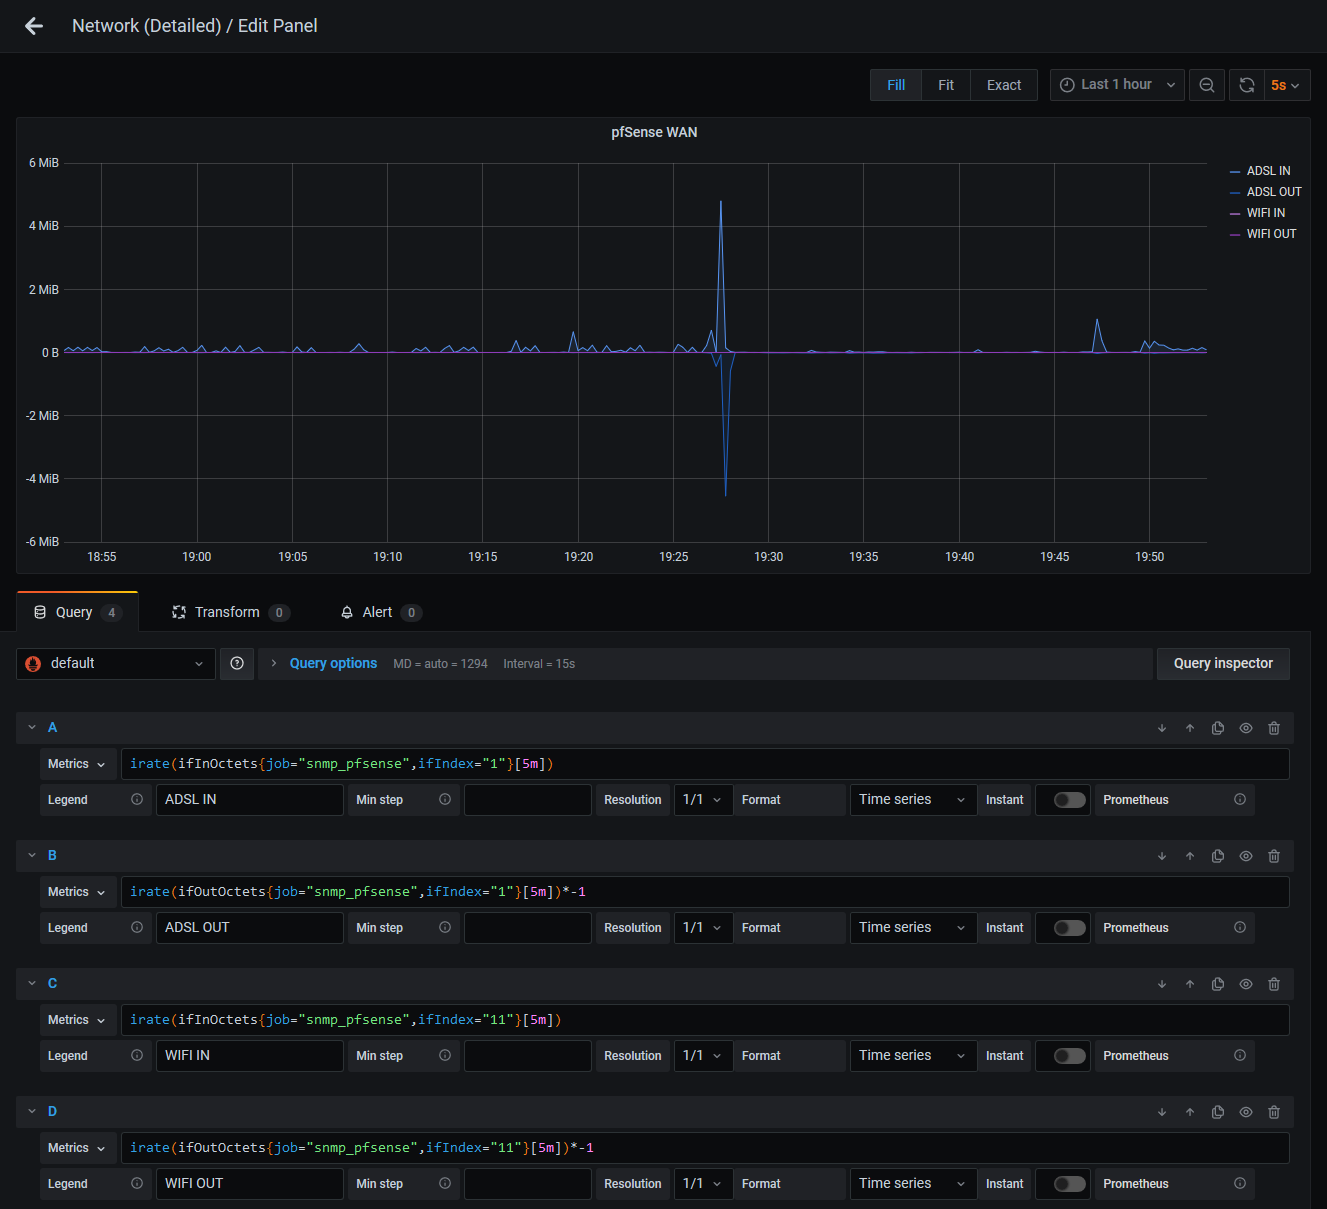
Here’s a couple of Grafana elements I use in my main network dashboard.
Octets In / Out
I have a few of these setup for interfaces of interest.
This is created with the Graph visualization with irate queries for ifInOctets and ifOutOctets, with the ifOutOctets result being flipped by multiplying by -1:
# A
irate(ifInOctets{job="snmp_pfsense",ifIndex="1"}[5m])

# B
irate(ifOutOctets{job="snmp_pfsense",ifIndex="1"}[5m])*-1
To figure out the ifIndex value to use, consult the results from the ifDescr query we ran in the Prometheus console earlier.
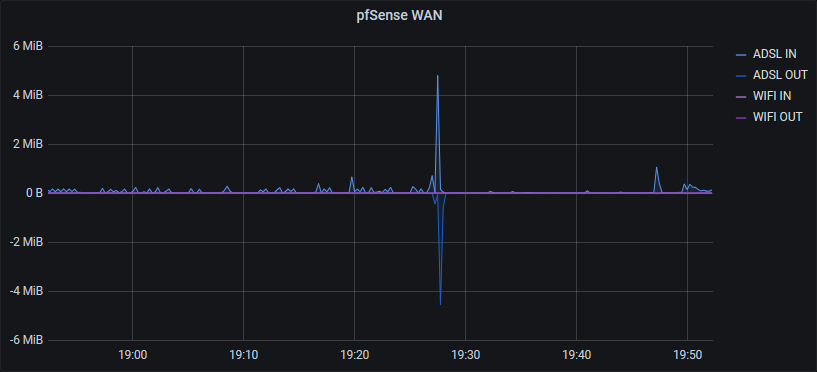
In the case of my pfSense WAN graph I actually have two IN/OUT pairs on the same graph (ADSL and WIFI) since I have two uplinks thanks to my 4G failover:
State Table
It’s handy to keep an eye on the state table since performance degrades as the state table grows. On my network dashboard I have visualizations for the absolute size and the percentage consumed:
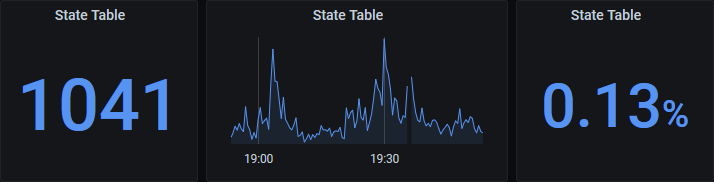
These panels are as follows:
- A Stat panel showing the state table count with
pfStateTableCount{job="snmp_pfsense",instance="10.80.2.1"} - A Graph panel showing graphing the same query
- A Stat panel that calculate the percentage using the state table capacity obtained from the pfSense console:
pfStateTableCount{job="snmp_pfsense",instance="10.80.2.1"}/805000

Conclusion
While there’s quite a few moving parts involved in setting this up, once you get your head around what those parts are it’s fairly straightforward to get going, as long as you test that each step is working properly. Once up and running it’s very stable, and it’s nice to be able to get visibility on the state of your network from a nice Grafana dashboard.