In my homelab, some nodes are expected to be running 24x7 (e.g. my monitoring host) while others are online only when needed (e.g. the Octoprint node that controls my 3D printer). I wanted to create a Grafana dashboard and corresponding Prometheus alerts to catch when those nodes expected to be always-on are down for some reason.
I implemented this a couple of different ways, but my last approach was to attach a custom label to node_exporter jobs using relabeling and to then use that custom label to drive the alert rules.
This turned out pretty clean and could be used for other purposes also, so I thought I’d write it up.
Goal State
My up/down dashboard looks like this:
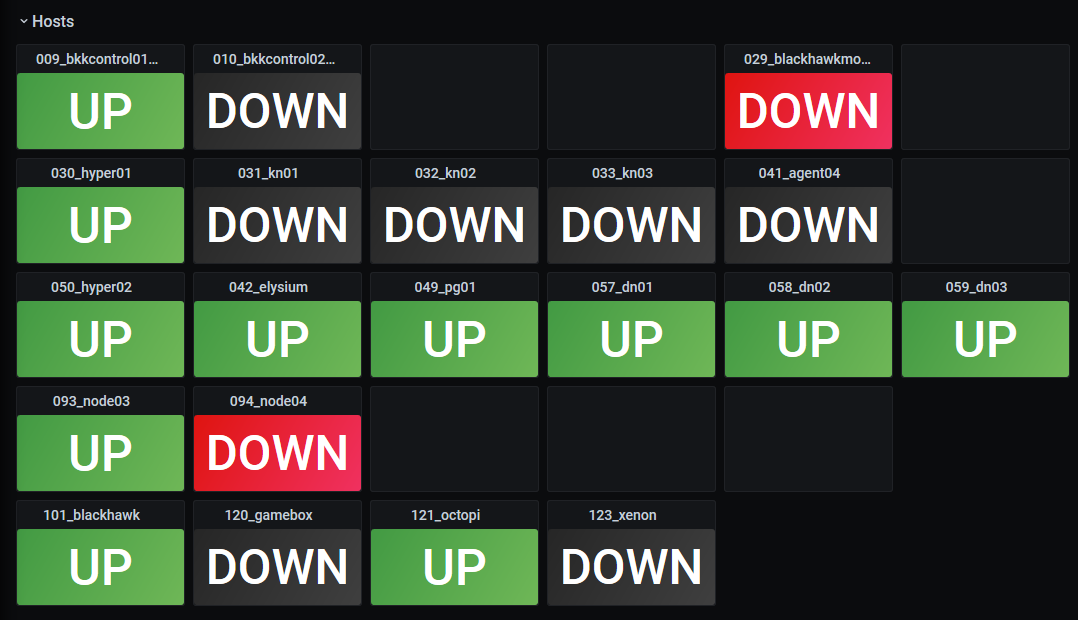
The indicator tiles show one of the following states:
- UP - if the host is up, regardless of whether or not it’s an always-on host
- DOWN (grey background) - if the host is down and it’s not an always-on host
- DOWN (red background) - if the host is down and it’s an always-on host
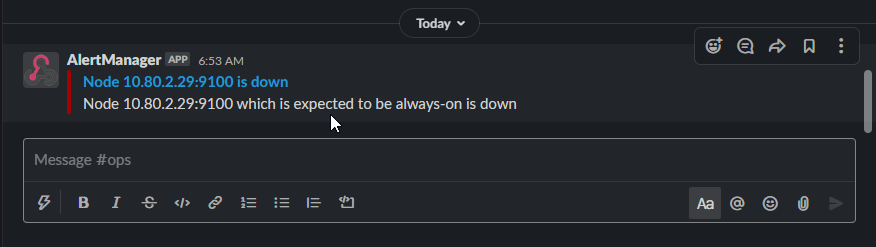
And alerts get sent to me via Slack so I can get them on my phone or desktop:
IP Address Management
As quick background, in my home network’s I use a simple addressing scheme aligned to octets:
10.<site>.<network>.<host>
Here, the last octet identifies the host and is unique across networks and sites. This comes with some drawbacks (limited to 254 devices, kind of doesn’t model the case where a device has more than one NIC) but for now it makes some other things simpler and my network is small and static enough that I know nodes by their ID number.
My goal then was to be able to identify which nodes, by ID, are expected to be always-on and which are not. For example node 93 which is my on-prem backup server should be always-on whereas node 121 which is my Octoprint controller is on when I need it.
Extracting IPAM Dimensions
Here’s my node_exporter scrape job:
scrape_configs:

  - job_name: "node"
    static_configs:
      - targets:
          - "10.80.2.9:9100"    # bkkcontrol01
          - "10.80.2.10:9100"   # bkkcontrol02
          - "10.80.2.15:9100"   # dc0
          ...
          - "10.80.2.120:9100"   # gamebox
          - "10.80.3.121:9100"   # octopi
First I added some simple relabel config’s to extract the site_id, subnet_id and host_id values from the IP address according to the addressing scheme noted above:
    relabel_configs:
      # Extract the site ID (second octet of IPv4 address)
      - source_labels: ["__address__"]
        regex: "\\d+\\.(\\d+)\\.\\d+\\.\\d+.*"
        target_label: "site_id"
      # Extract the subnet ID (third octet of IPv4 address)
      - source_labels: ["__address__"]
        regex: "\\d+\\.\\d+\\.(\\d+)\\.\\d+.*"
        target_label: "subnet_id"
      # Extract the host ID (last octet of IPv4 address)
      - source_labels: ["__address__"]
        regex: "\\d+\\.\\d+\\.\\d+\\.(\\d+).*"
        target_label: "host_id"
After restarting with this config in place we can test it using the Prometheus console at http://PROM_HOST_IP:9090/:
> up{job="node"}

up{host_id="34",instance="10.80.2.34:9100",job="node",site_id="80",subnet_id="2"}	0
up{host_id="35",instance="10.80.2.35:9100",job="node",site_id="80",subnet_id="2"}	0
up{host_id="36",instance="10.80.2.36:9100",job="node",site_id="80",subnet_id="2"}	0
up{host_id="29",instance="10.80.2.29:9100",job="node",site_id="80",subnet_id="2"}	0
up{host_id="42",instance="10.80.2.42:9100",job="node",site_id="80",subnet_id="2"}	1
Mapping Always-On Label
With the basic IPAM dimensions extracted it’s now easy to add two more relabel configs to set a new “alwayson” label to either true or false based on the host_id value:
      # Set alwayson=true by host_id
      - source_labels: ["host_id"]
        regex: "9|29|50|42|49|57|58|59|93"
        replacement: "true"
        target_label: "alwayson"
      # Set alwayson=false by host_id
      - source_labels: ["host_id"]
        regex: "10|15|30|31|32|33|34|34|35|36|41|120|121"
        replacement: "false"
        target_label: "alwayson"
Testing again in the Prometheus console we see the label is attached as expected:
> up{job="node"}

up{alwayson="false",host_id="34",instance="10.80.2.34:9100",job="node",site_id="80",subnet_id="2"}	0
up{alwayson="false",host_id="35",instance="10.80.2.35:9100",job="node",site_id="80",subnet_id="2"}	0
up{alwayson="false",host_id="36",instance="10.80.2.36:9100",job="node",site_id="80",subnet_id="2"}	0
up{alwayson="true",host_id="29",instance="10.80.2.29:9100",job="node",site_id="80",subnet_id="2"}	0
up{alwayson="true",host_id="42",instance="10.80.2.42:9100",job="node",site_id="80",subnet_id="2"}	1
Consuming Always-On Label to Trigger Alerts
Now in the Prometheus rules config we can add an entry to catch where an alwayson node is down using the up function:
  - name: Node
    rules:
      - alert: node_down_alert
        expr: up{alwayson="true"} == 0
        for: 30s
        labels:
          severity: "critical"
        annotations:
          topic: "node_down"
          title: "Node  is down"
          description: "Node  which is expected to be always-on is down"
The alwayson label we attached with the relabel config enables a very simple expression that matches to all those nodes.
Compare this to the original expression before I figured out relabeling:
expr: label_replace(
  up{job=~"node|windows",instance!~"10.80.2.30.*|10.80.2.31.*|10.80.2.32.*|
    10.80.2.33.*|10.80.2.41.*|10.80.2.120.*|10.80.2.121.*|10.80.3.123.*"},
    "alwayson", "true", "", "") or
  label_replace(up{job=~"node|windows",
   instance=~"10.80.2.30.*|10.80.2.31.*|10.80.2.32.*|
     10.80.2.33.*|10.80.2.41.*|10.80.2.120.*|10.80.2.121.*|10.80.3.123.*"},
     "alwayson", "false", "", "")
Much harder to read and to maintain - and this wasn’t even handling all devices yet!
Finally in the Alertmanager config we can route the “node_down” alert defined above to wherever we want it to go:
route:
  receiver: "slack-notifications"
  repeat_interval: 12h
  routes:

    # node_down - do email-bren every 15 minutes
    - receiver: "email-bren"
      match:
        topic: "node_down"
Dashboard Config
As mentioned at the beginning I color panel background grey or red depending on the always-on-ness of a node, however in Grafana there’s no way (at least not that I’ve found so far) to select colors based on expressions, so I’ve had to manually create each one separately. Hopefully in the future it’s easier to repeat panels with properties defined dynamically.
Further Reading
Learn more about relabeling from:
- Relabeling config docs from Prometheus project
- Life of a Label from Brian Brazil’s blog