I need a weather station and this weekend I started building one. I’ll be working on this on-and-off over the next few months so I figured I’d post progress updates along the way.
Today’s update covers:
- Base platform (a Raspberry Pi)
- BME280 sensor integration for barometric pressure, humidity and temperature readings
- Data plane built on MQTT, Telegraf, InfluxDB and Grafana
A goal of this project, in addition to building an actual weather station, is to provide my configuration as a reusable artifact upon which others can build their own similar projects. To that end, my code and documentation are on GitHub and licensed under GNU GPLv2.
Architecture
My goal state architecture is as follows:
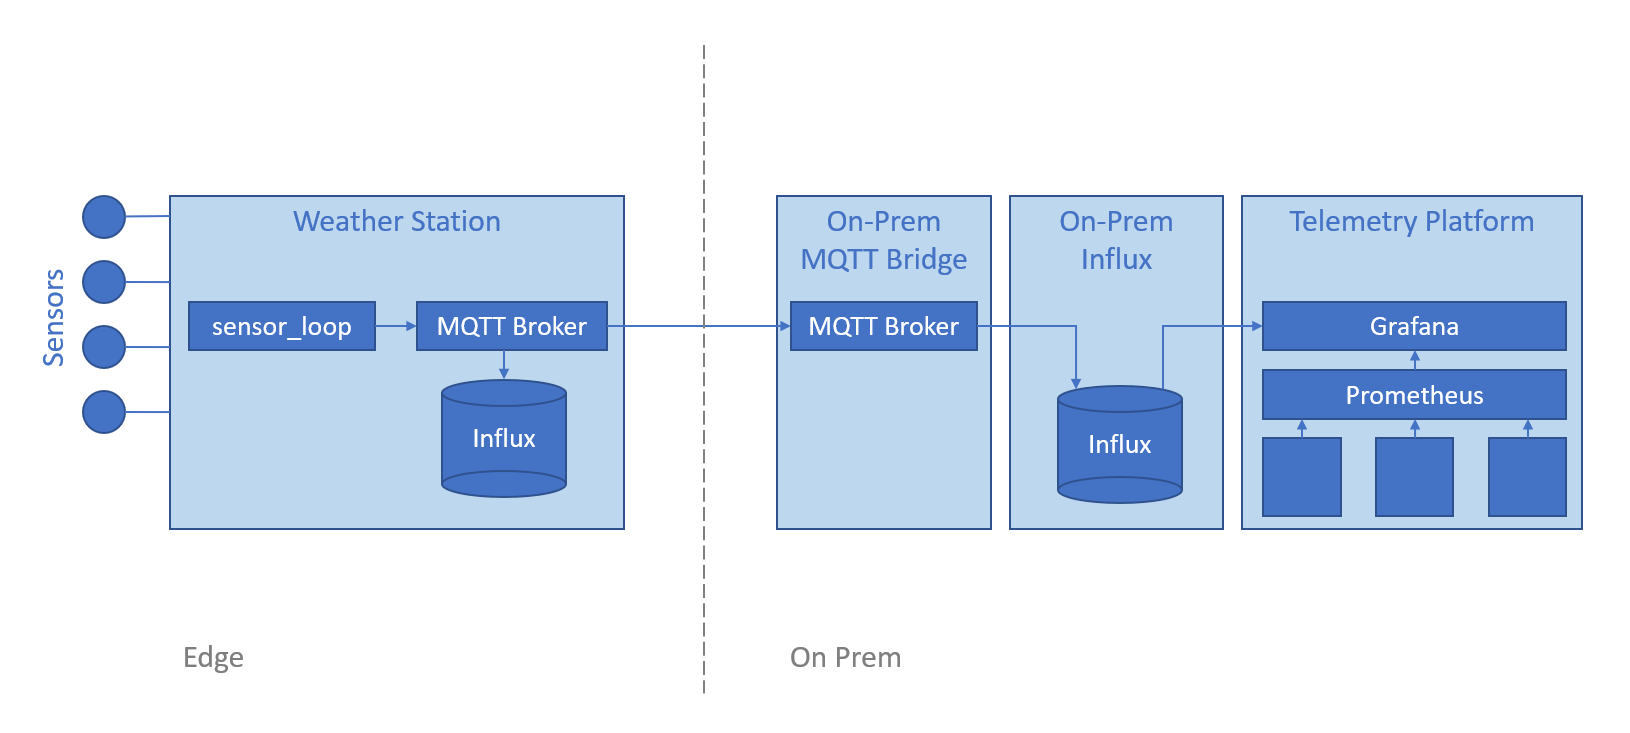
In summary
- The weather station should have it’s own MQTT broker and local storage so that if network comms are interrupted, measurements are still captured and are buffered to be sent out once comms are restored.
- An on-prem MQTT bus will bridge measurements from the weather station at the edge into the internal network from where they can be fed to other locations
- For now measurements will just be stored in another InfluxDB instance on-prem to feed into Grafana dashboards on my existing telemetry stack alongside other dashboards that are populated from Prometheus such as my UPS monitoring dashboard. Later I may also pipe measurements from that on-prem MQTT broker up to AWS.
This weekend I got all the major components on the weather station itself in place and added a dashboard to my Grafana instances to pull metrics directly from the station’s local InfluxDB.
Sensors
The full suite of metrics that the station will eventually monitor are:
- Wind Speed (Misol anemometer)
- Wind Direction (Misol wind vane)
- Temperature (BME280 sensor)
- Humidity (BME280 sensor)
- Barometric Pressure (BME280 sensor)
- Air Quality (TGS2600 sensor)
- PM 2.5 (PMS5003 sensor)
- Sunlight (visible, UV-A, UV-B via a GY1145 sensor)
- Lightning Strikes (AS3935 sensor)
- Rainfall (Misol rain gauge)
- Gasses (MQ-2, MQ-3, etc, etc - around 5 of them)
- Ground Temperature (DS18B20 sensor)
- Ground Moisture (generic capacitive sensor which will probably corrode out in about 3 weeks)
v1 Build
Hardware
This weekend my focus was getting the base platform bedded down and stable, along with integrating the first sensor.
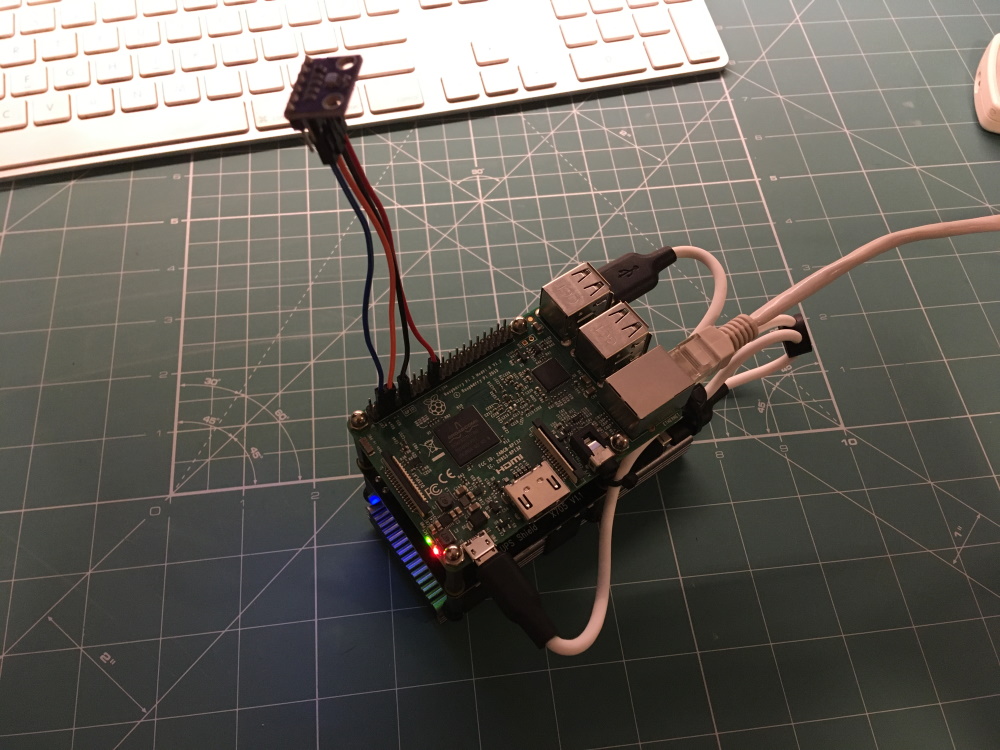
I put it together from the following components that were in my parts cabinet:
- Raspberry Pi 3B
- X705 UPS Board with two 18650 lithium batteries installed
- Transcend 128GB M.2 SSD in a USB-C enclosure
- Various metal stand-offs, bolts and nuts
- Hoco brand silicon sleeved short USB-C and micro-USB cables
I also 3D printed a bracket to mount the SSD onto stand-off posts to secure it to the platform.
I won’t go through the full build - if you’ve done anything with Raspberry Pi’s there’s nothing complicated here.
The only challenge I encountered was that initially I tried to power the Pi via one of the JST outputs from the UPS board and it was persistently undervolting. After switching to micro-USB the UPS board seems to provide enough power to drive the Pi with the attached SSD with not a single undervolt event. I’ve had this UPS board for a while and I don’t recommend it - there are a lot better options available these days.
Even though the UPS board isn’t the best, it does provide the assurance that if the mains power supply fails the station will continue to run for at least a couple of hours (an endurance test is TBD).
Sensor
I had to solder the breakout pins onto my BME280 but after that connecting it up was easy thanks to the Raspberry Pi Weather Station project guide which I followed pretty much exactly for this part.
Software
Getting the software up and running took a while mostly because I realized that Influx 2 doesn’t offer an official arm7 Docker image and so went off on an Ubuntu Server 20 64-bit LTS tangent for a while. In the end I came back to 32-bit Raspberry Pi OS with Influx 1.8 because I found the Ubuntu Server distro really slow on my Pi 3.
I won’t explain every little thing because it’s actually documented in detail in the README.md in my GitHub repo, however to summarize the build process:
- Setup base OS - in my case this involved enabling SSD boot because I definitely do not want to run my weather station off a SD card
- Setup Docker, Docker Compose, I2C
- Setup few Prometheus exporters so that the weather station host itself can be monitored by my existing telemetry-stack - given that I’m also using Telegraf to ship weather station measurements, I could potentially replace the Prometheus exporters with Telgraf and save some CPU and memory - will consider that
- Clone my weather-station repo
Then to start everything up:
# Launch the MQTT broker
cd mqtt-broker
./start.sh

# Launch the local InfluxDB instance with Telegraf data shipper
cd ../local-storage
./start.sh

# Launch the Python script to read sensors
cd ../sensor_loop
python3 main.py
Note I’m currently running this from inside a tmux session so I don’t need to nohup it. I will be wrapping the sensor_loop script in a Docker image soon so that it’s easier to manage as a service. My sensor_loop script BTW is based off the sample code from the previously mentioned Raspberry Pi Weather Station project guide which is recommended reading if you want to do something like this.
Dashboard
Finally I added my weather station as a datasource in Grafana and created a dashboard. Naturally I’m practicing infrastructure-as-code so the datasource was defined in my Grafana provisioning config as follows:
apiVersion: 1

deleteDatasources:
  - name: "hea92weather01"
    orgId: 1

datasources:
  - name: "hea92weather01"
    type: "influxdb"
    access: "proxy"
    database: "weather"
    user: "grafana"
    password: "password"
    url: "http://10.80.2.31:8086"
I created the dashboard through the Grafana UI but then exported it into my Grafana git repo so it can also be provisioned on launch. The dashboard, which is not that exciting yet, looks like ths:
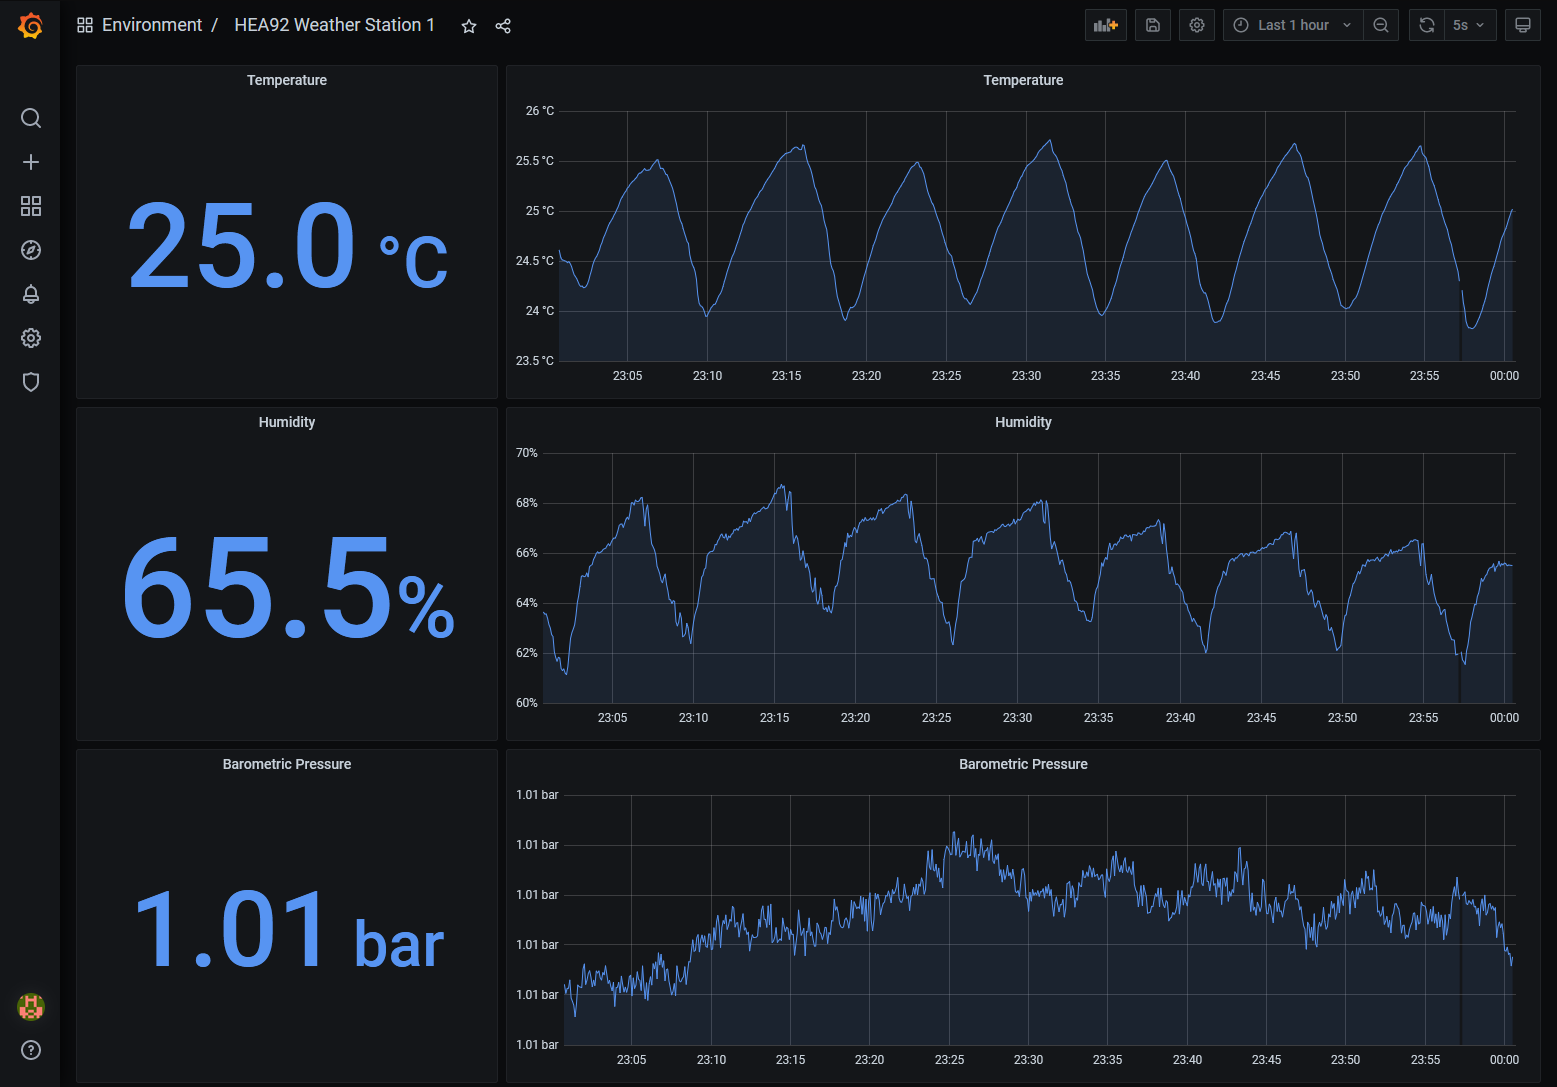
The saw-tooth nature of the temperature and humidity readings is because the station is sitting in my home office and so it’s showing the fluctuations as the air conditioner turns on and off. It’s amazing how immediate the temperature change is when you can observe it in tenths of a degree as the BME280 offers.
I also found it interesting that the BME280 is reading the air pressure as anywhere from 1001 to 1005 milli-bars - this is plausible since much of Bangkok is actually below sea-level! Although where I am is about 15 meters above sea-level.
Next Steps
The next things to do are:
- Tuning and improvements on the edge InfluxDB including tuning retention window settings to keep as much data as possible without exhausting the SSD capacity.
- Setup the MQTT bridge to get data off the station and into my main network where it can be further routed.
- Setup the on-prem InfluxDB instances to accumulate the data.
- Update my Grafana config to use the on-prem InfluxDB’s instead of the edge InfluxDB.
- Add the next sensor which will probably be the lightning sensor since I have one in my parts box, it’s also I2C so should be easy, and we’re just entering rainy season in Bangkok and there’s a lot of lightning to detect!